Digital Asset Demand Returns!
News
|
Posted 08/11/2022
|
12808
Following a fourth consecutive US rate hike of 75bps, a small pullback has occurred in the Dollar Index allowing global equities a brief period of relief - allowing digital assets demand to return.
Despite this, the stress present in the bond market remains persistent with further inversions across the front end of the yield curve, most notably in the 3month T-Bill in respect to the 10yr risk-free rate.
In response, Bitcoin prices have experienced a relatively small upwards surge, applying upwards pressure on key on-chain cost bases in its first attempt to establish a stable and price-respected bottom. This price action is supported by muted HODLer behaviour (Long-term dormancy) and the first evidence of demand re-entering the market, as the asset class attempts to begin the long climb out of the depths of the bear market. So, is the bear market over?
As always, we first look to the long-term HODLers, to inspect their spending behaviour.
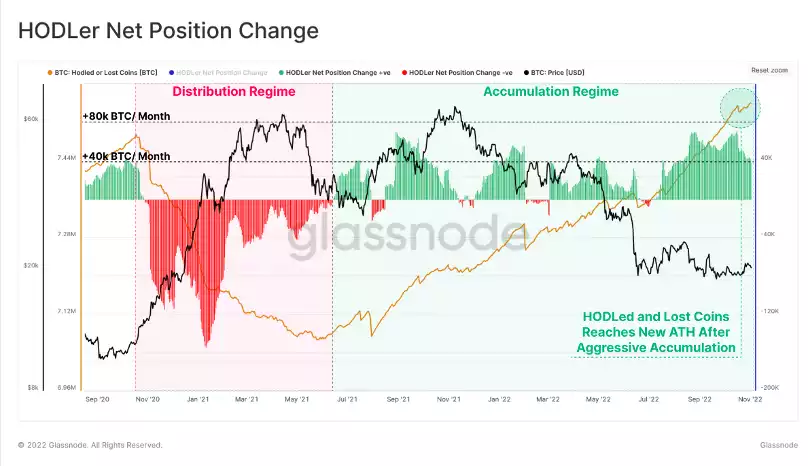
A contradiction in HODLer's behaviour can be observed on either side of the May 2021 sell-off. Before this inflection point, HODLers can be seen aggressively distributing coins, realising profits into the cycle topping formation. Distribution peaked at a rate of -150k BTC / Month, expending a total of -450k BTC in the process.
Following a breakdown in price action, the spending footprint of HODLers transitioned into an accumulation regime, amassing coins at a rate of+40k BTC / Month. This regime has culminated in a cumulative inflow of +500k BTC over 8 months – which is quite extraordinary.
This process has fully replenished the reserve of coins distributed this cycle and pushed the HODLed and Lost coins metric to a new ATH – effectively meaning that the market has 'reset' from its surge in late 2021.
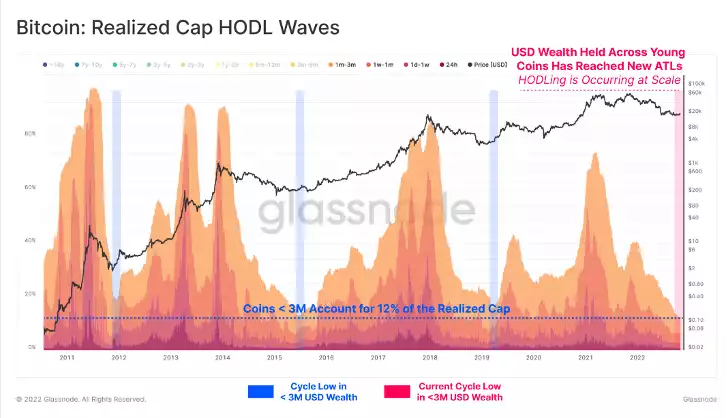
Next, we can look at the Realised Cap HODL Waves, which allow for the inspection of USD-denominated wealth held by specific coin-age cohorts. Isolating for coins younger than 3-months old can be used to approximate the wealth of the speculative investor class.
Currently, the USD wealth held by young coins is at an all-time low, representing only 10% of the network Realised Cap. Under a binary system, this means that wealth that is older than 3 months has reached an ATH in both relative, and absolute terms of the network Realised Cap. This suggests the HODLer cohort is the most dominant they have ever been, signalling a resounding refusal to spend and sell, despite the persistent challenges in global capital markets. To repeat, it appears that the market has 'reset'.
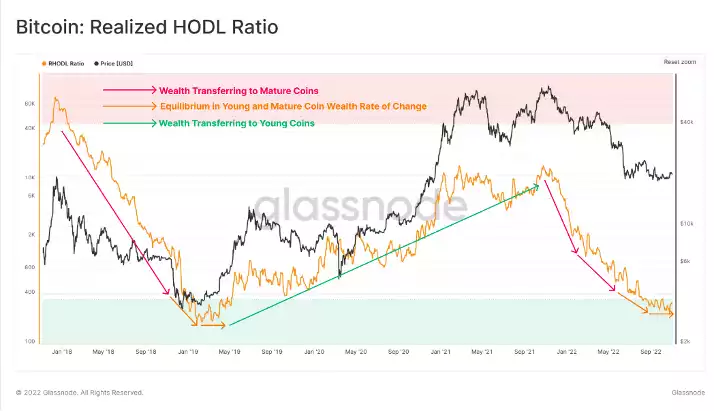
To expand on this data, we can employ the Realised HODL Ratio to compare this balance of wealth held between young and mature coins in an oscillator. This can be considered under the following framework:
An uptrend in RHODL Ratio suggests growing dominance of USD wealth held by newer speculative buyers and is typical of bull markets, and Bitcoin market tops. Bad.
A downtrend in RHODL Ratio indicates the growing dominance of USD wealth held in older coins, suggesting increased HODLing, and long-term accumulation behaviour. Good.
A flat, range-bound RHODL Ratio indicates that the rate of change between old and young dominance is at equilibrium. This transitional period is often observed around market inflection points such as distributive markets tops, and accumulation bottoms. Pivot point.
After remaining within a downwards trending regime since the November ATH, the angle of descent is beginning to soften (as shown in the chart below), suggesting the balance between young and old coin wealth is finding equilibrium – a potential pivot point. This pattern is occurring at similar levels and duration to that observed in the 2018-19 market low. What remains unknown is how long the market stays at this equilibrium. In 2018-19 it lasted a meagre 3 months, but macro-conditions were much more favourable for the speculative crypto market. This time? Time will tell…
Looking elsewhere, we see constructive signs of demand returning to the market. A small, but noticeably consistent change is taking place in the Bitcoin on-chain transactions. This has manifested as a sustained increase in total coins transferred hitting the BTC Mempool. This change in character provides initial signs of a potentially constructive shift in demand. This trend remains in its infancy but is one to monitor and could prove to be THE inflection point in the market.
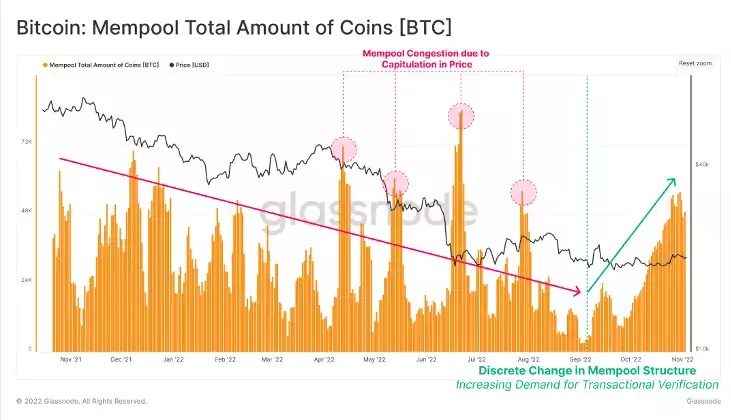
To conclude and summarise what we are witnessing on-chain, HODLers are attempting to sustain a floor price, it is the Short-Term Holders who must step in and inject organic capital into the system to aid in the stabilisation of key levels – so far this has been occurring, but must sustain to provide long-term relief to the market. This is evidenced by both the structural change to Mempool activity as well as the surge of activity from small entities, as the demand for transactional verification and network usage slowly, but surely grows.
Despite unprecedented conditions across global markets, the structural price action of Bitcoin remains similar to prior cycles as the price marches towards both the market-wide cost-basis, as well as the Short-Term Holder cost-basis. Reaction to these key levels will be imperative to monitor in the coming weeks, as a confirmed flip of these resistance levels suggests the first glimmers of recovery across the long, arduous road ahead.