Did We See THE Pivot?
News
|
Posted 01/11/2022
|
12155
Last week we said “expect volatility”. Bitcoin rallied back above the key US$20k psychological level, after many months of extremely low volatility. So, what risks may lay on the road ahead? Have we seen the pivot in the market? Let’s explore…
Pushing off a low of $19,215 at the start of last week, BTC traded as high as $20,961. After consolidating in an increasingly tight range since early September, this is the first relief rally in many months. Typically after trading within a tight range for an extended period, the market breaks out in a bullish direction – which proved true. From an on-chain perspective, we are witnessing an almost textbook bottom.
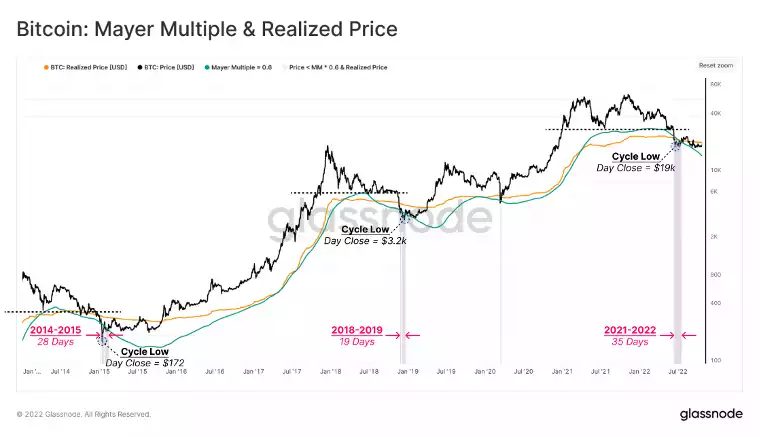
The market is currently in a “Bottom Discovery phase”. This phase has historically seen prices range bound between two well-known floor-tracking models:
- Realised Price: This can be considered the average acquisition price per coin for the wider market. When the spot price trades below the realised price, the aggregate market can be considered to be an unrealised loss.
- Mayer Multiple Lower Band (0.6*200 DMA): The Mayer Multiple is simply the ratio between price and the 200D-SMA, a widely observed model in traditional financial analysis. This metric helps gauge over, and under-bought conditions, with cyclical oversold conditions, historically coinciding with Mayer Multiple values below 0.6.
Remarkably, this pattern has repeated in the current bear market, with the June lows trading below both models for 35 days. The market is currently approaching the underside of the Realised Price at $21,111, where a break above would be a notable sign of strength.
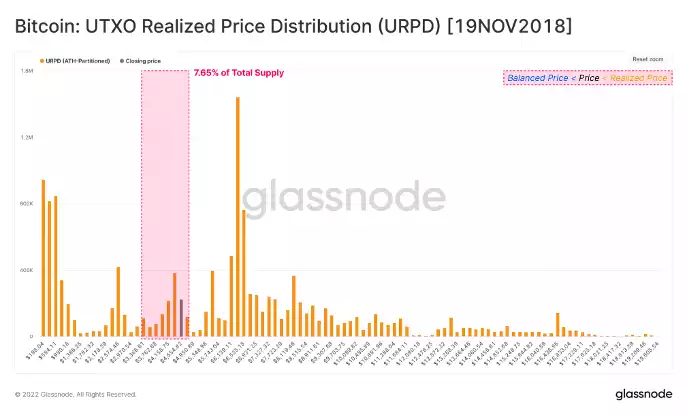
Throughout the “Bottom Discovery phase,” diminishing investor profitability results in the redistribution of coin wealth, as weaker hands capitulate into extreme financial pain. This progressive changing of hands can be analysed by tracking the Realised Price Distribution (URPD), which illustrates the distribution of supply based on the acquisition price.
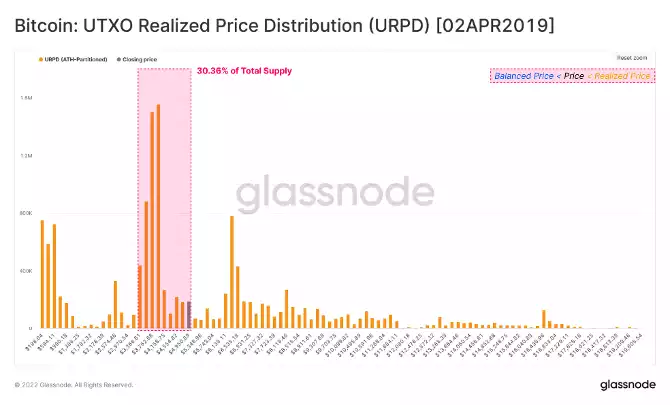
The magnitude of wealth redistribution can be highlighted by monitoring the change in the volume of coins with an acquisition price within the two pricing models highlighted above. The following two charts compare the URPD on the entry, and exit dates for the 2018-19 bear market:
- URPD as of 19-Nov 2018 when the price first broke below the Realised Price.
- URPD as of 2-Apr-2019 when the price broke out above the Realised Price.
During the 2018-2019 bottom discovery phase, around 22.7% of the total supply (30.36% - 7.65%) was redistributed as spot prices traded within the range.
Performing the same analysis in 2022, we can see that around 14.0% of supply has been redistributed since the price fell below the Realised Price in July, with a total of 20.1% of supply now having been acquired in this price range.
Compared to the end of the 2018-19 cycle, both the magnitude of wealth redistribution and the final supply concentration at the bottom is somewhat lower in the 2022 cycle. This adds further evidence to the case that additional consolidation and duration may still be required to fully form a bear market floor.
That said, the redistribution which has occurred to date is significant, and certainly indicates that a resilient holder base is actively accumulating within this range.


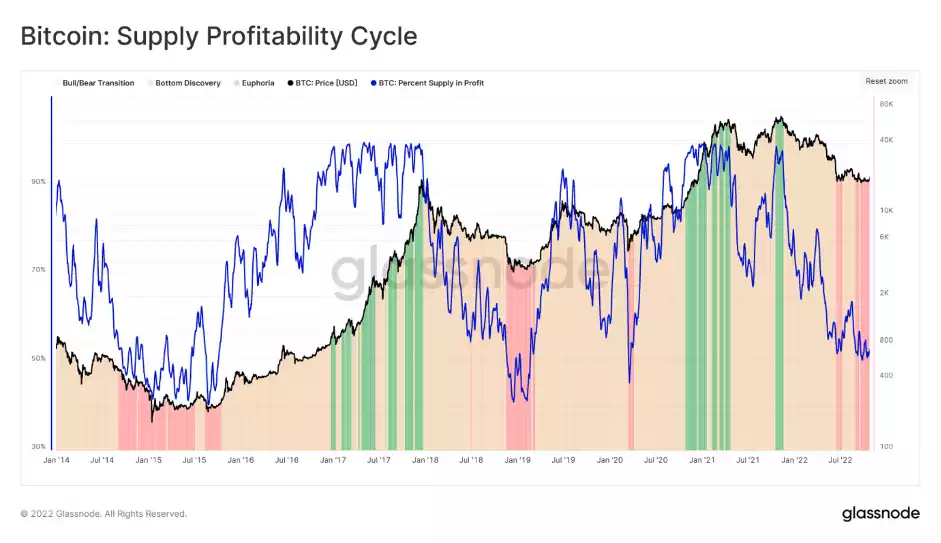
With many longer-term components of a bear market floor in play, the next step is to introduce a series of indicators that are useful for mapping out a potential transition back towards a bull market. The Percent of Supply in Profit metric can be used to establish three distinct states of each market cycle:
- Euphoria
- Bottom Discovery
- Bull/Bear Transition
At present, the Percent of Supply in Profit is at 56%, which indicates that the recent price recovery above $20k is at the lower bound of the transitional phase, signalling that an appreciable redistribution has occurred below $20k to date.
In summary, the portion of supply which has changed hands and been repriced so far is significant, although smaller in magnitude compared to the 2018-19 lows.
From both the Unrealised and the Realised Profit/Loss standpoints, the results indicate that a fragile but constructive balance between supply and demand exists in the market