Breaking Down the Dynamics Behind the Rise of the Bitcoin Market: Short Squeezes and Spot Demand Drive January Rally
News
|
Posted 31/01/2023
|
11842
Bitcoin markets have seen an impressive monthly price performance, with the strongest performance since October 2021. The rally has been fuelled by both an increase in spot demand and a series of short squeezes.
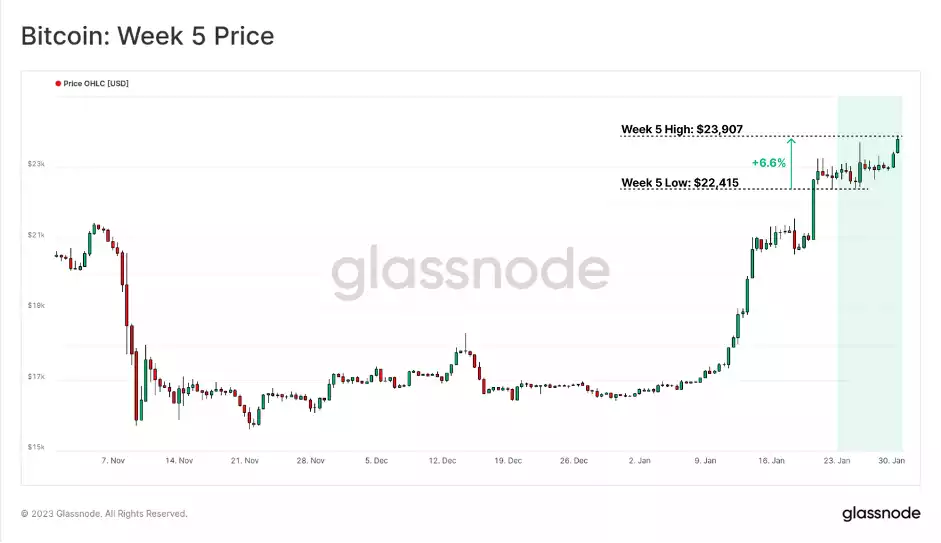
Short Squeezes Trigger Impressive Reversal in Bitcoin Market Trend
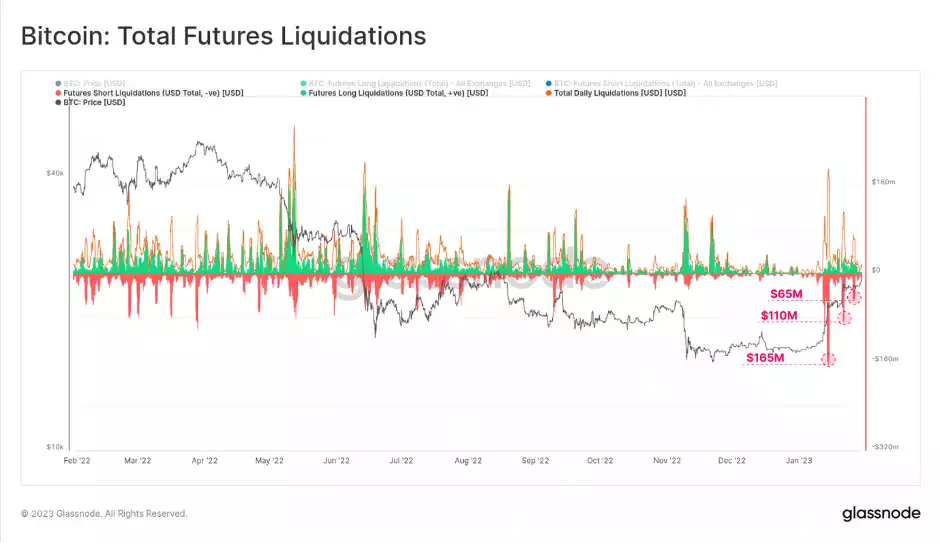
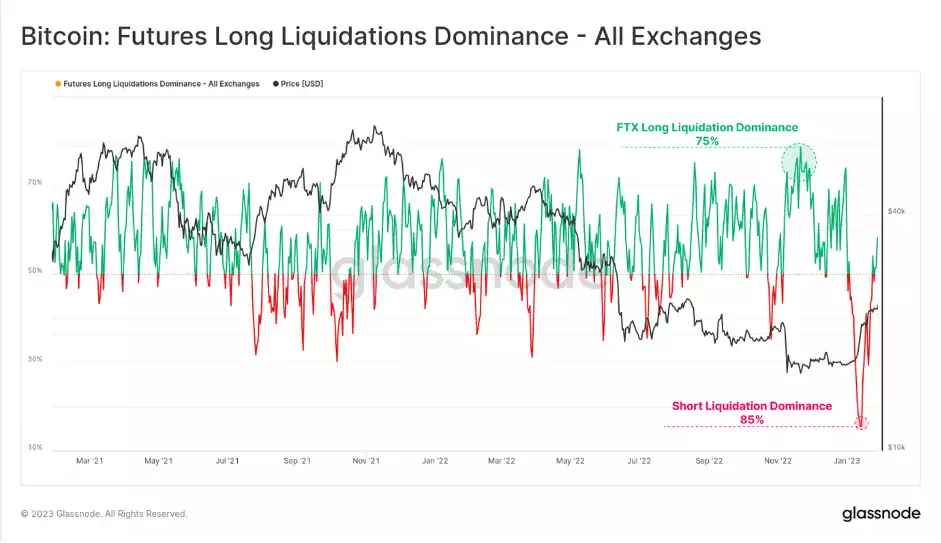
Short squeezes in derivative markets have played a significant role in this month's reversal of the downtrend. There have been over $495 million in short futures contracts liquidated in three waves, with each wave becoming smaller as the rally continued. This initial short squeeze caught many traders off guard, with long liquidation dominance reaching an all-time low of 15%, which is a larger magnitude than the long liquidations during the FTX implosion.
The initial short squeeze in mid-January caught many traders off guard, leading to an unprecedented 15% long liquidation dominance, with 85% of the liquidations being short positions. This is a larger magnitude compared to the long positions liquidated during the FTX implosion, which had a 75% long dominance, highlighting the extent to which traders were caught by surprise.
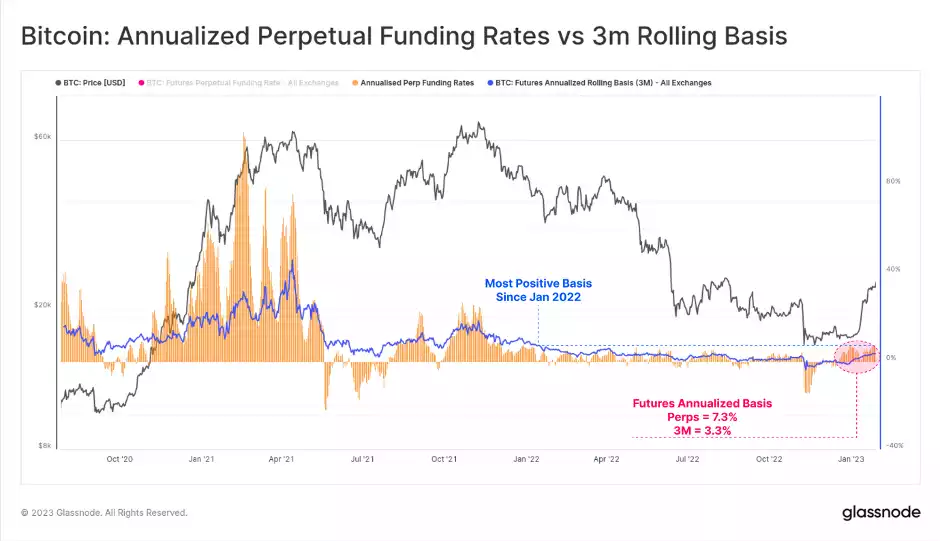
Decreased Leverage in Futures Markets Highlights Growing Importance of Spot Markets in Driving Bitcoin Price
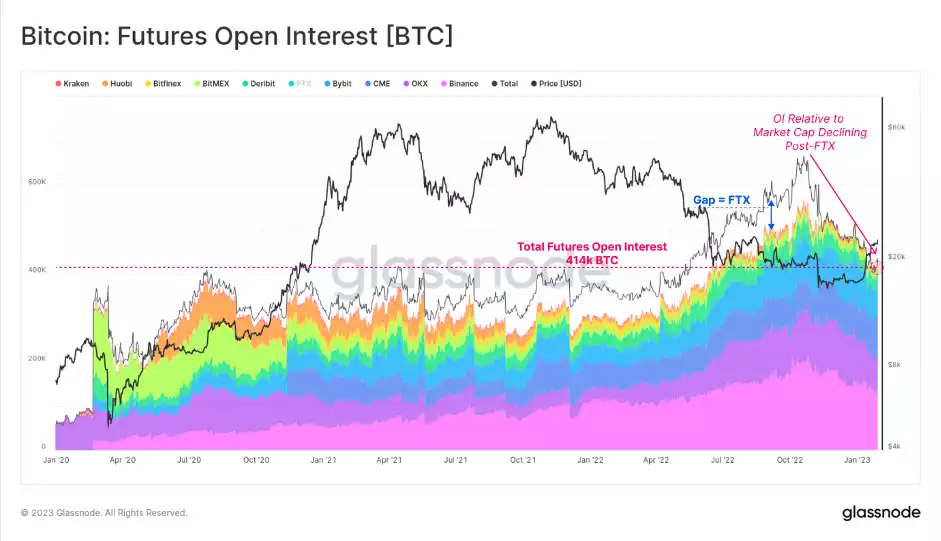
However, despite this positive change in futures markets, the total open interest relative to the Bitcoin market cap has been declining since mid-November. The value of open futures contracts denominated in BTC has fallen by 36% over this time, from 650k BTC in mid-November to 414k BTC today. This decline can be attributed to a loss of 95k BTC worth of open interest held at FTX.
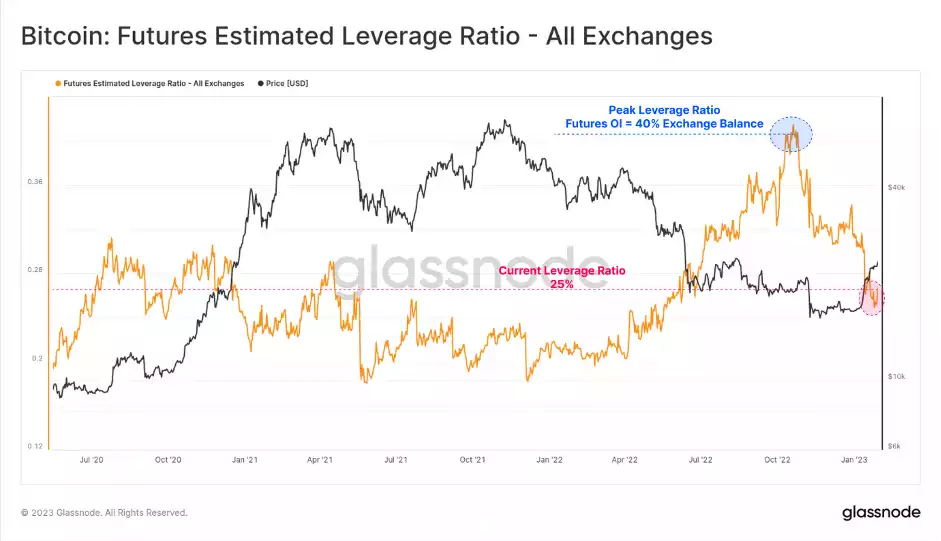
Comparing the notional size of open futures contracts to the BTC balance on corresponding exchanges reveals a decline in leverage within the market. This leverage ratio has decreased from open interest equal to 40% of spot exchange balances to 25% over the past 75 days. This reduction in futures leverage and closing of short speculative interest puts more emphasis on spot markets as a key driver of the current market structure.
On-Chain Data Points to Growth Beyond Exchanges
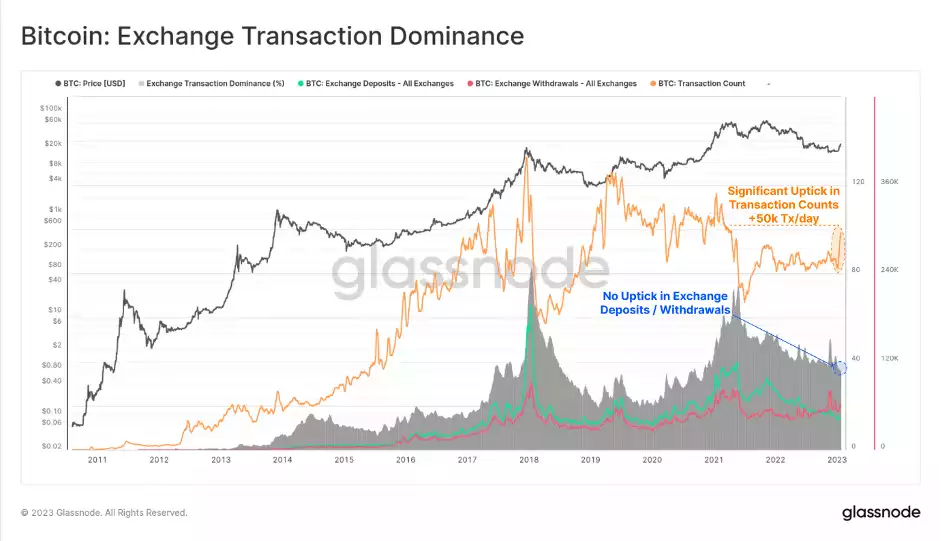
On-chain transactions for Bitcoin have increased by over 50k transactions per day, but there is no corresponding increase in exchange deposits or withdrawals. Exchange-related transactions represent just 35% of total transactions, with this dominance remaining in a downtrend since the May 2021 market peak. This increase in transaction activity suggests that recent growth is occurring elsewhere within the Bitcoin economy.
BTC’s Average Acquisition Price
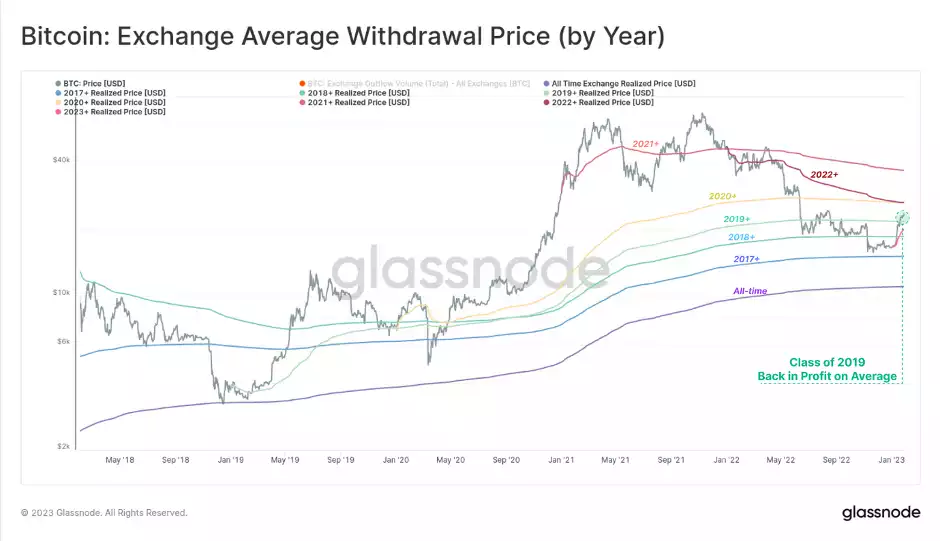
An estimate of the average acquisition price for various cohorts of the Bitcoin economy can be calculated by looking at the large volumes of coins flowing in and out of exchanges. The average acquisition price for each year's class can be calculated starting on January 1st each year and modelling a long-only DCA cost basis. Through the 2022 downtrend, only investors from 2017 and earlier avoided a net unrealised loss, while the class of 2018+ saw their cost basis taken out by the FTX red candle. The current rally has pushed the class of 2019 ($21.8k) and earlier back into an unrealised profit.
Summary - Spot Demand, Short Squeezes, and a Shift in Market Structure
In conclusion, the strong performance of the Bitcoin market this month has been fuelled by both an increase in spot demand and a series of short squeezes. The rally has brought a large portion of the market back into profit and resulted in futures markets trading at a healthy rate. The decline in open interest and reduction in futures leverage signals a reduction in short-term downside hedge positions and puts more emphasis on spot markets as a key driver of the current market structure.