Bonds at a Cycle Low: What Comes Next
News
|
Posted 30/09/2026
|
730
Key Takeaways
- Long dated US bonds may be carving out a major cycle low after years of selling.
- Falling yields could give the Fed room to cut without destabilising the bond market.
- The longer term picture still points to rising yields and an inflationary regime.
- Gold and silver performed strongly through the last one, from 1950 to 1980.
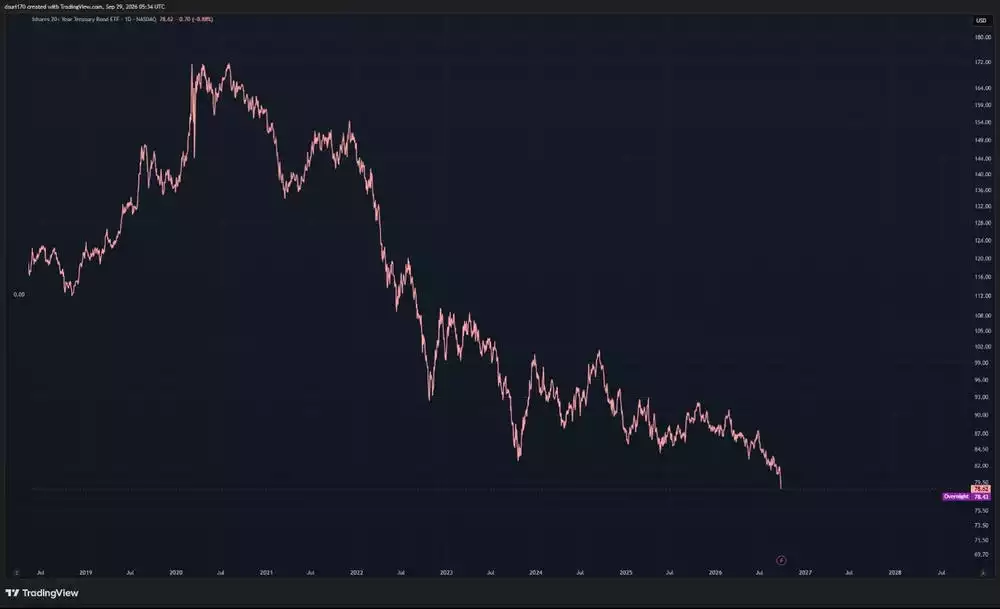
While the mainstream media has been extensively covering the sour sentiment across US bond values, this is exactly the mainstream coverage and sentiment one should expect at a major cycle low, right in the timing window of long term US bonds carving out a major 7.5 year cycle low. The largest long dated Treasury ETF closed at a record low of US$80.46 on 23 September 2026 and has lost more than half its value since its 2020 peak (Bloomberg, 23 September 2026).
If this low was confirmed, it would build an expectation of a very high probability uptrend in bond prices in the short term, leading to falling bond yields.
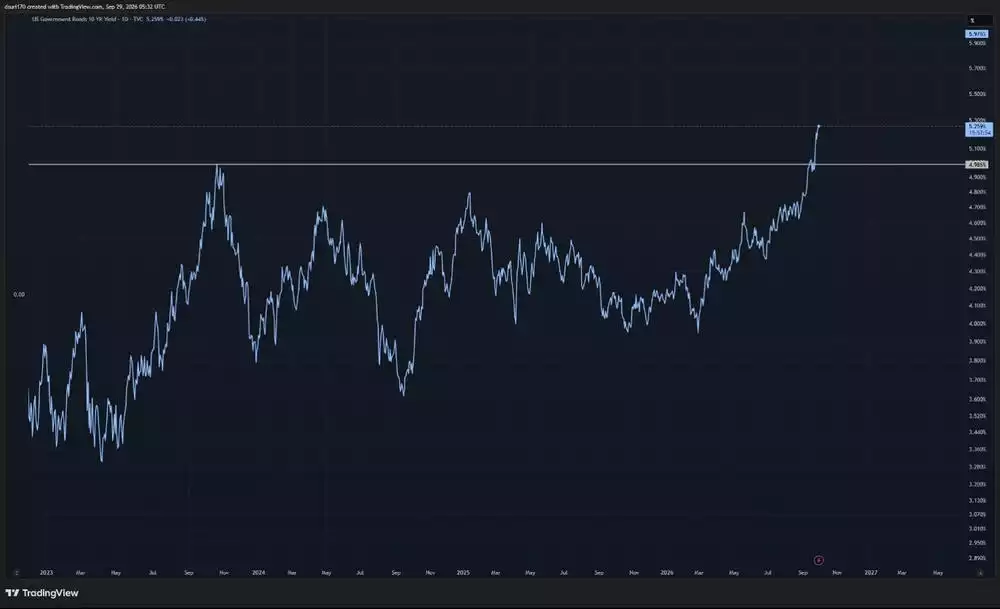
While market participants have simultaneously been panicking about non stop rising yields, along with major mainstream news coverage as the US10Y yields have broken out of a multi year range, the bond value sentiment can be applied in reverse to yields to further add confluence to this expectation. The 10 year yield broke above 5% on 14 September 2026 for the first time since 2023, and reached 5.25% on 28 September, its highest since June 2007 (Bloomberg, 14 September 2026, Trading Economics, 29 September 2026).
Why the bond market, not the Fed, sets the ceiling
While the US Fed consistently jawbones around inflation and unemployment, it is really the bond market in aggregate that determines what the Fed is able to do with interest rates. This is because lower rates affect the short end of the yield curve, and with the long end moving up, it results in a yield curve spike, which could destabilise the entire global financial system.
An environment of rising bond yields can restrict the Fed from cutting rates, regardless of inflation falling or unemployment rising. A turn in bond collaterals upwards and falling yields would create the breathing room for the US Fed to cut rates without destabilising the bond market.
The counter case is that the long end is pricing a higher term premium for persistent inflation, heavy issuance and fiscal risk rather than a cycle low. On that read, elevated yields could stay in place for some time rather than resolving downwards (CNBC, 15 September 2026).
While the high likelihood of falling bond yields and interest rates (based on cyclical expectations) exists for the short-term (1 year), the long term (10 year) view is one of consistently rising yields (and therefore interest rates) as we enter a new inflationary regime (1950-1980 precedent).
Gold and silver performed extremely well during this period.
What the four turnings show
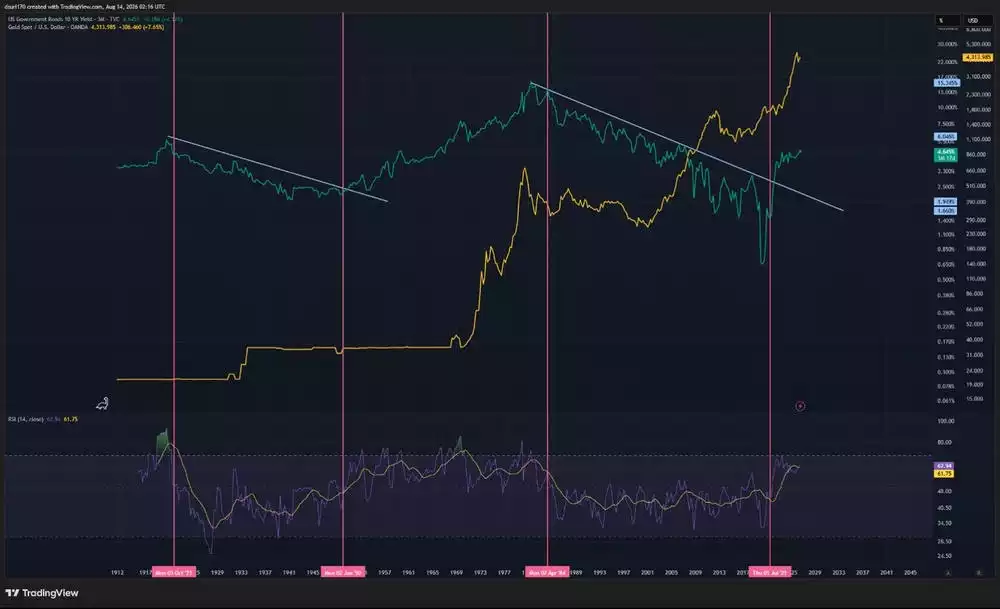
We can see on the chart above, bond yields and the gold price over the current 80 year socio-economic cycle (the four turnings), a framework formulated by historians Neil Howe and William Strauss in 1997 (Ainslie Bullion, 17 October 2024).
In the fourth turning of the previous cycle, and the current fourth turning, we see decades of falling yields (blue) with the RSI below 50. Post WWII, as we entered the first turning of the current cycle, we saw yields start to trend up after breaking out of a multi decade trendline with the RSI moving to and holding above 50, this then saw decades of rising yields (and interest rates) with the RSI above 50, over the first and second turnings of this cycle, leading to 1980. The 10 year sat at 2.32% in 1950 before its record 15.82% in September 1981 (Multpl, Trading Economics). Gold and silver went on multi decade bull runs during this time, with the gold to silver ratio largely oscillating between 20 and 40, dipping to about 14 at the January 1980 peak (Longtermtrends via Visual Capitalist). After this we entered the current third and fourth turnings, where yields once again began declining.
Today we see the yields breaking out once again from a multi decade trendline, the RSI holding above 50, right as the current fourth turning builds to a finale.
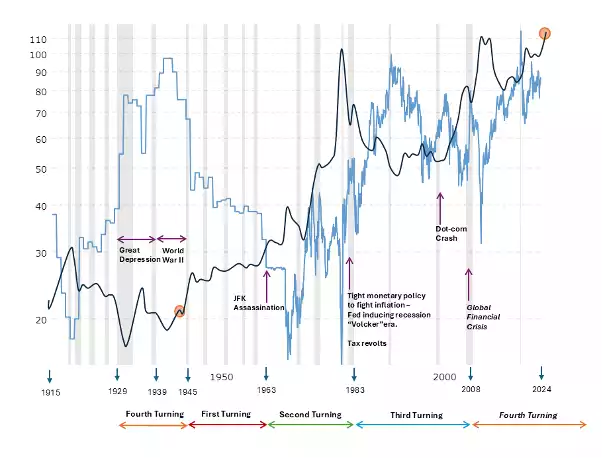
The chart below shows the gold to silver ratio from 1915 to 2024, overlaid with the four turnings of society. We can see how silver performed during the first and second turnings while bond yields and interest rates were rising from 1950-1980. Silver ran from around US$0.90/oz in the early 1950s to US$49.45/oz on 18 January 1980, and the ratio fell away as each turning gave way to the next (Money Metals, SD Bullion, Ainslie Bullion, 17 October 2024).
While we transition from one human made system to the next, society returns to gold and silver as assets outside any human system to navigate the chaos of transition. Ainslie Bullion has been helping Australians hold physical gold and silver since 1974, and a thesis measured in decades tends to favour accumulating through the cycle rather than timing a single entry.
_______________________________________________
This article is general information only and does not constitute financial advice. Past performance is not indicative of future results. Always conduct your own research or consult a licensed financial adviser before making investment decisions.