Bond Yields Could Signal Decades of Rising Rates, Inflation and Currency Devaluation
News
|
Posted 02/09/2026
|
1101
Key Takeaways
- Long-term US bond yield charts have turned up after four decades of falling rates.
- Rising yields have historically arrived alongside inflation, which gold absorbed in the 1970s.
- US federal debt passed US$40 trillion in August 2026, and Treasury is buying back long bonds.
- Hard assets can hold purchasing power while a currency unit is steadily debased.
While the thought of high bond yields amid record US debt sounds impossible to navigate for the US government, most market participants are bracing for ongoing intervention in the bond market, with the Fed and the Treasury holding the beach ball underwater for as long as they can.
That expectation is not theoretical. US federal debt was confirmed at US$40.01 trillion on 19 August 2026 (US Treasury, Debt to the Penny). On the same day, Treasury announced it would at least double the maximum size of its buyback operations in longer-dated bonds, from US$2 billion to at least US$4 billion, running from 9 September to 4 November 2026 (CNBC, 19 August 2026). Economist Mohamed El-Erian described the purchases as small relative to net issuance and more about “a broader deployment of ‘yield curve control’”.
However the laws of nature remain undefeated, and the current landscape suggests a sustained uptrend in bond yields could persist over the long term (although a medium term pullback is reasonable to expect).
What the chart shows
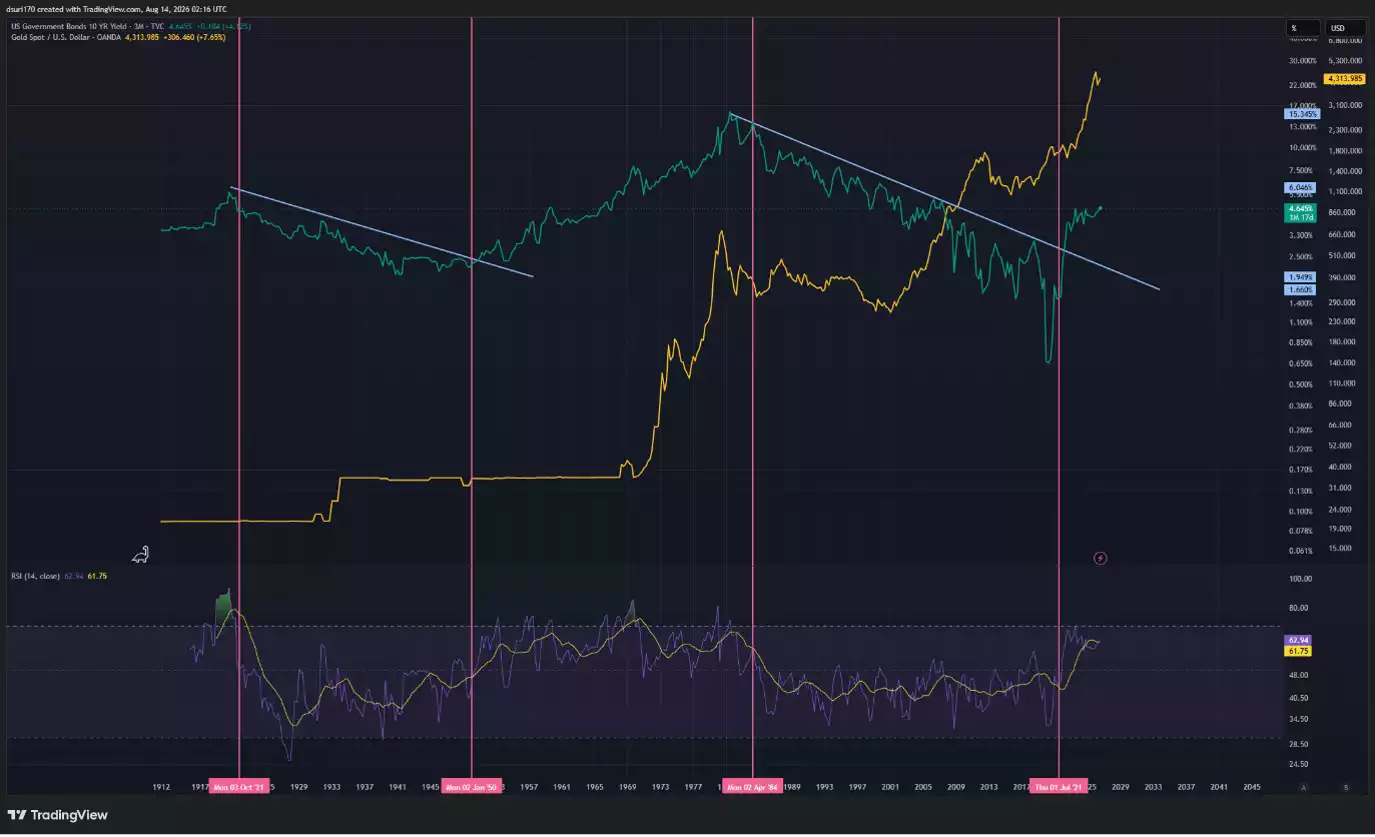
The chart below shows the 3M chart of the US10Y bond yield (teal) with the RSI indicator below and the gold price overlaid.
We see two long periods of falling yields, from the early 1920s to 1950 and from the early 1980s to the early 2020s, where the RSI is held below 50 and a macro downward trendline is respected on the price chart of the yields. On the underlying data, the 10-year yield peaked at 15.82% in September 1981 and bottomed at 0.55% in August 2020 (Trading Economics; Advisor Perspectives).
Between 1950 and the early 1980s (culminating in the Volcker era, when the average 30-year US mortgage rate reached 18.63% in October 1981 after a decade of runaway inflation) we see bond yields in a sustained uptrend while the RSI is held above 50 (Freddie Mac).
What happened to gold last time
During this period we also saw the Bretton Woods system end, where the dollar had been convertible to gold at US$35 per ounce for foreign official holders until President Nixon closed the gold window on 15 August 1971 (IMF). After which gold went vertical to absorb the inflation, running from US$35 an ounce to a peak of US$850 in January 1980.
While the current gold price isn’t suppressed to the same degree, we do have inflation, with incessant central bank (and more recently the US Treasury) intervention adding fuel to the fire. Most importantly we have the US10Y 3M chart breaking out and holding for a sustained period above the long term downtrend, with the RSI holding up above 50. That combination has historically preceded a longer term uptrend in yields, a traditionally inflationary environment. The US 10-year yield sat at 4.80% on 1 September 2026, its highest since January 2025 (Trading Economics).
While yields and rates aren’t able to compensate for asset inflation (they aim to tackle, albeit gently, consumer price inflation) hard assets like gold and silver have historically provided a store of wealth that the currency unit has not.
Where the dollar fits
The dollar is unlikely to disappear altogether. In this environment it could complete its transformation into a unit of trade and a means of funding government activity, most likely in an increasingly digital form. That form is already taking shape through regulated dollar stablecoins rather than a central bank digital currency: the GENIUS Act, signed on 18 July 2025, requires payment stablecoin issuers to hold one dollar of permitted reserves for every dollar issued, limited to cash, insured bank deposits, short-dated Treasury bills, Treasury-backed repo and government money market funds (Congressional Research Service). Executive Order 14178, signed 23 January 2025, separately prohibits US agencies from establishing, issuing or promoting a CBDC. A dollar token backed by short term government debt is built for payments. It is not built to be a store of value or a unit of savings.
What it means for investors
Gold and silver are among the few assets that can serve as a store of value while simultaneously providing financial sovereignty: the ability to hold one’s wealth outside the mainstream financial system, in an asset that carries no counterparty and cannot be issued at will, while human made systems transition over multiple decades.
Central banks are positioning the same way. They bought a net 289 tonnes of gold in the second quarter of 2026, the strongest Q2 in the World Gold Council’s data series and a 62% increase year on year, even as the gold price fell over the quarter (World Gold Council, Gold Demand Trends Q2 2026). Ainslie Bullion offers a full range of gold and silver bullion for investors building a position through the cycle.
This article is general information only and does not constitute financial advice. Past performance is not indicative of future results. Always conduct your own research or consult a licensed financial adviser before making investment decisions.