Bond Market Calm, and What Followed It Last Time
News
|
Posted 22/09/2026
|
1547
Key Takeaways
- Bond market volatility is historically low, and calm has preceded past dislocations.
- The land cycle and the 80 year cycle both point to a short deflationary phase first.
- After the Great Depression, a brief dip in yields gave way to decades of rising yields.
The US bond market has been the foundation of the debt based global financial system in the current 80 year socio-economic cycle (made up of 4, 20 year phases called the four turnings) of which we are in the final innings (final years, of the fourth turning), a framework set out by Strauss and Howe (CDAMM).
The previous fourth turning culminated in The Great Depression as the world transitioned from one centennial cycle to the next.
Each 20 year "turning" consists of about 1 land cycle (18.6 years on average measured from low to low, per Phillip Anderson's work on two centuries of US land sales data), and the previous turning (3rd turning) concluded with the Global Financial Crisis (Property Share Market Economics).
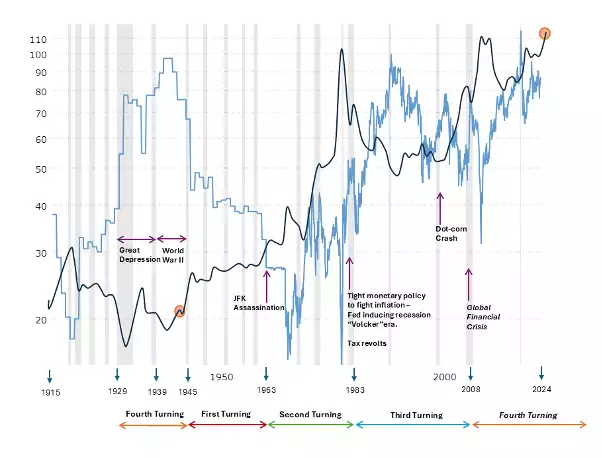
The setup looks like the lead in to the GFC
Looking at the bond market today we see a setup uncannily similar to the lead in to the GFC. Bond market volatility (as measured by the MOVE index) in a downtrend, with a breakout in volatility leading into the peak of the stock market, before the crash. The MOVE hit a four year low in late October 2025 and sat at 81.20 on 21 September 2026, against a since-inception average near 103. Last cycle it set a record low of 51 in May 2007, five months before the S&P 500 peaked on 9 October 2007, then reached its all time high of 264 in October 2008 (Reuters, IISES, chart below).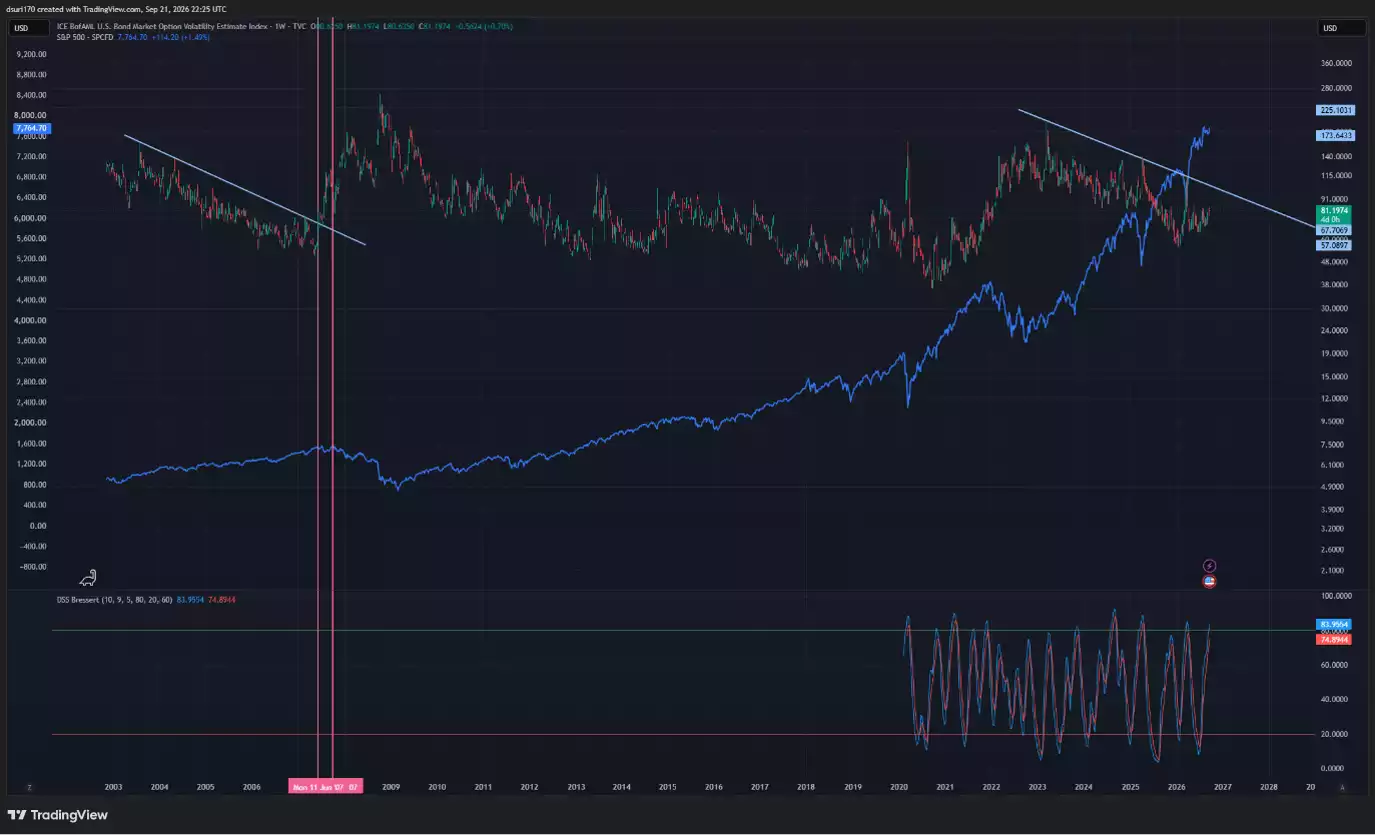
With the US bond market being the foundational collateral for the global debt system, volatility results in a major liquidity drain, due to risk premiums shooting up.
We also saw bond yields and interest rates held stubbornly high leading into the GFC, with yields rolling over amid a deflationary crash in stocks and land. The funds rate held at 5.25% from June 2006 until the Fed cut to 4.75% on 18 September 2007 (Federal Reserve), with the 10 year above 5% until July 2007 (CNBC).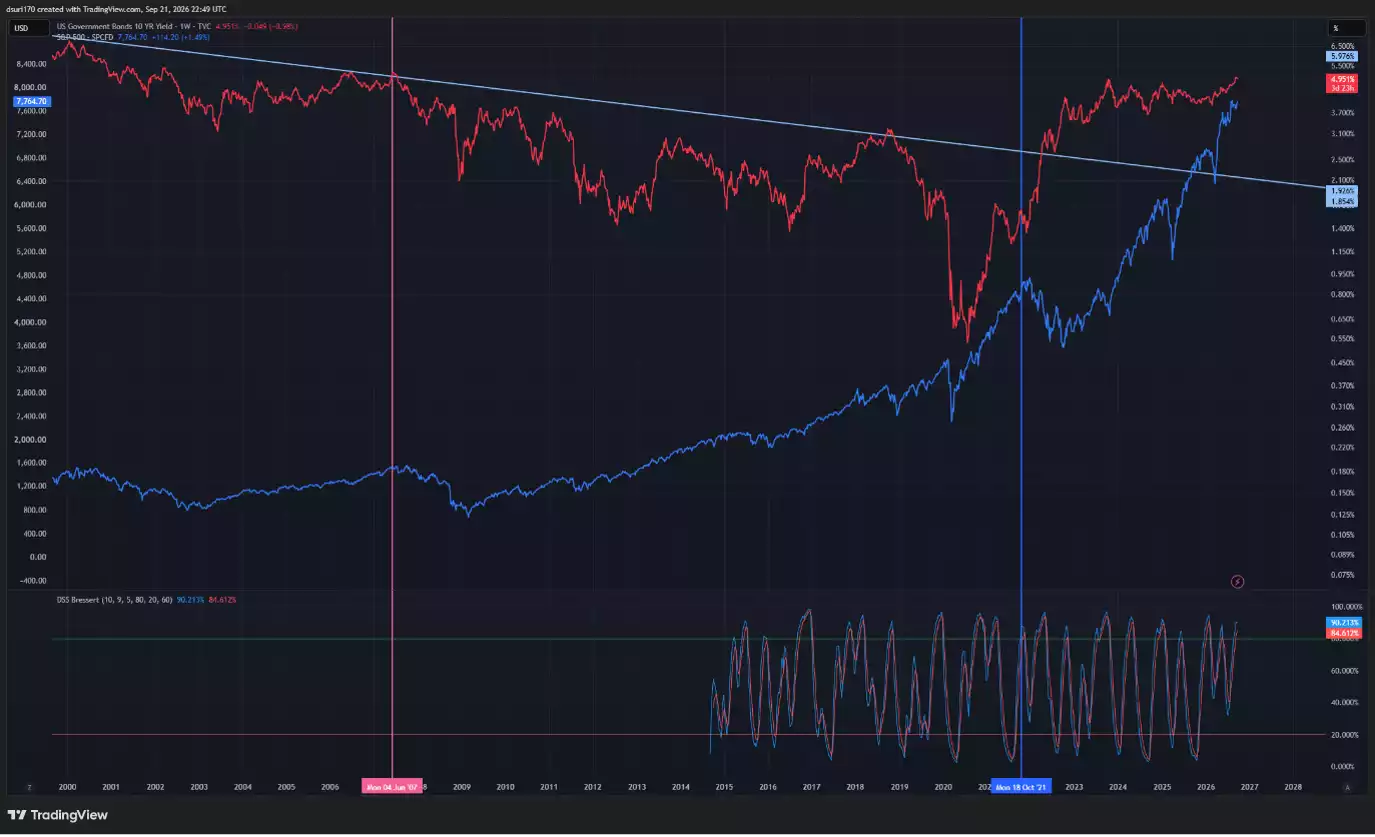
What happened after the Great Depression
While a (similar to the GFC) pullback in bond yields, interest rates, amid bond market volatility would certainly be a flight to safety environment, resulting in bond collaterals increasing, if we look at how yields behaved after the Great Depression leading into the first turning of the current 80 year cycle, we can note that a short term pullback in yields was followed by decades of rising bond yields and falling collateral values. The 10 year sat at 1.95% in 1941 and 2.32% in 1950, before its record 15.82% in September 1981 (Multpl, Trading Economics).
While both the 18.6 year land cycle and the 80 year cycle point to a short, deflationary period, of falling yields, looking at the bigger picture points towards a new regime, of rising yields and rates, amid decades of inflation (1950-1980).
This coincides with US bonds having been downgraded by all 3 major credit rating agencies, S&P in 2011, Fitch in 2023 and Moody's to Aa1 on 16 May 2025 (Reuters), while central banks now hold more gold than bonds. The ECB put gold at 27% of global official reserves at the end of 2025 against 22% for US Treasuries, though it attributed the shift mainly to price: valued at end-2023 gold prices, Treasuries would still lead on 26% against gold's 16% (ECB, The international role of the euro, 2 June 2026, summary). The potential beneficiaries of this environment could be precious metals as the safe haven asset of choice, in an inflationary, albeit high yielding environment.
During the precedent of 1950-1980 silver went on a multi decade bull run, while the gold to silver ratio remained below 50. Silver ran from around US$0.90/oz in the early 1950s, against a gold price fixed near US$35, to US$49.45 on 18 January 1980. The ratio's published monthly readings from 1968 stayed under 50 until the mid-1980s (MetalCharts, Longtermtrends via Visual Capitalist, Vaulted).
The counter case is that low volatility can reflect genuine confidence rather than complacency, and the cycle read is a framework, not a calendar. The 10 year reached 5.04% on 15 September 2026 before easing to 4.95% by 21 September, and if inflation cools the same chart resolves as a range rather than a regime change (Trading Economics).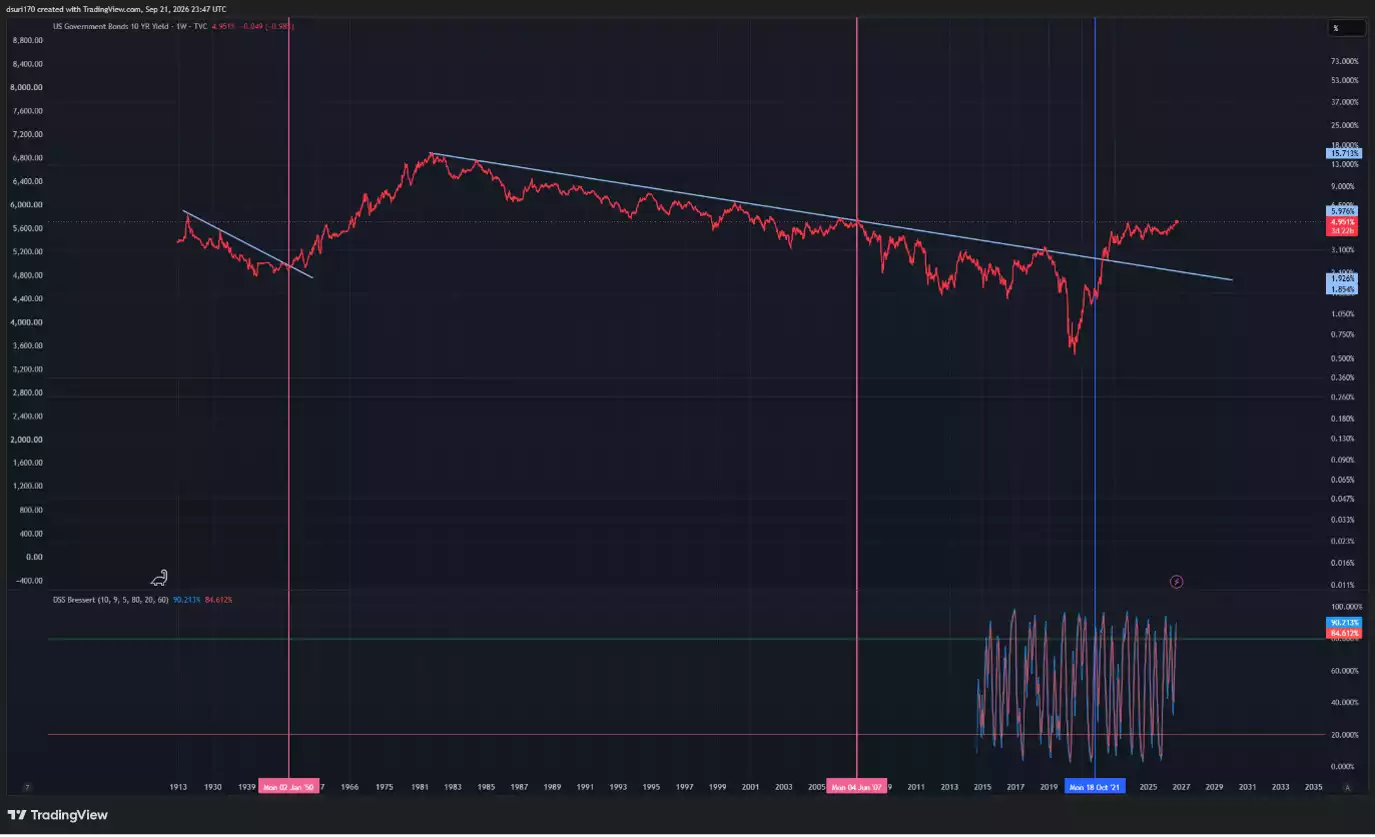
As we collectively transition from one centennial human system to the next we rely on an asset which has traversed the millennia over multiple centennial systems, providing safety, reliability and value for individuals and investors alike. Ainslie Bullion has been helping Australians hold physical gold and silver since 1974, and investors on a thesis this long dated tend to accumulate through the cycle rather than time a single entry.
_______________________________________________
This article is general information only and does not constitute financial advice. Past performance is not indicative of future results. Always conduct your own research or consult a licensed financial adviser before making investment decisions.