Bitcoin’s Onchain Fair Value
News
|
Posted 01/02/2022
|
9731
Bitcoin enters its 82nd day of the prevailing drawdown, as derivatives traders bet on further downside. Meanwhile, on-chain demand models suggest a more bullish undertone is in play.
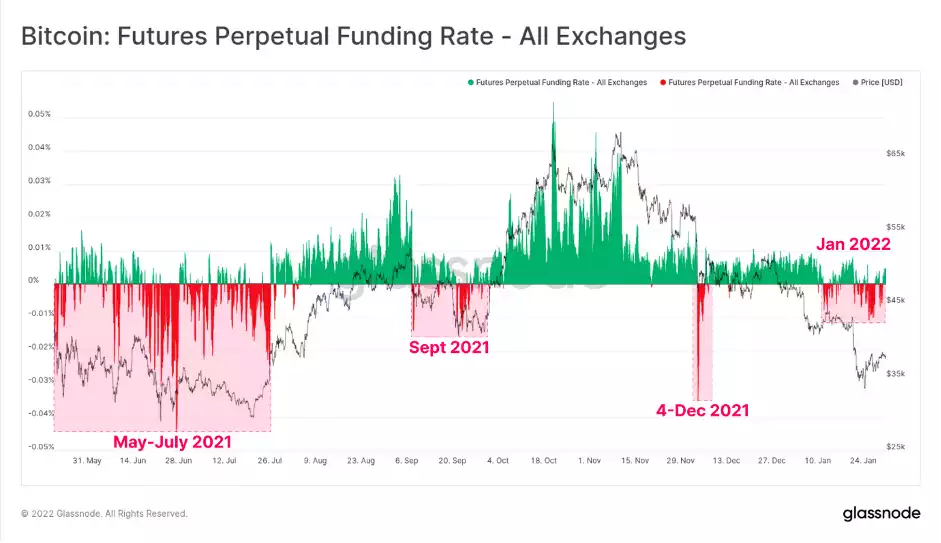
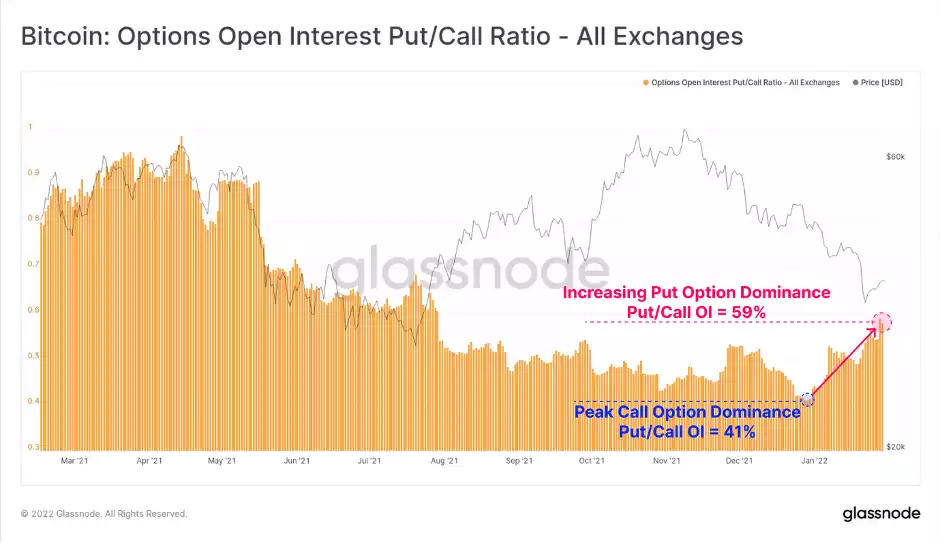
The Bitcoin market has continued to slide lower, reaching as low as $33,424 US, the lowest traded price since July 2021. Prices have now been in an established downtrend for 82-days, and negative sentiment has spiked higher, particularly across derivatives markets. Funding rates for perpetual swaps traded into negative territory, and we have seen a notable reversal in options markets, where put option volumes have increased markedly.
A primary theme in the market at the moment is the overly negative bias in the derivatives markets. Throughout 2021, trading volumes in futures markets have been in macro decline, falling over 50% from $80B/day in March 2021, to under $40B/day in January 2022. As is commonplace during high volatility events, this week's sell-off to $33k was met with a significant uplift in trading volume, hitting just under $60B/day.
Even with relatively low trading volumes, futures open interest remains remarkably elevated, particularly for perpetual swaps. As a percentage of the Bitcoin market cap, open interest in perpetual swaps (purple) is hovering around 1.3%, which is historically high, and often a precursor to a deleveraging event.
Open interest across all futures markets (including perpetual swaps) is elevated at 1.9% of market cap (orange), however, this is closer to the middle of the range in typical values. This observation indicates that a great majority of current futures leverage is held by traders of perpetual contracts.

With this elevated leverage and relevance of perpetual swap markets, we can look to funding rates to get a sense of market bias and direction where leverage is most heavily applied. Funding rates have traded negative for much of January, indicating that a modest short bias exists in perpetual swap markets.
Similar negativity is seen in options markets, with the Put/Call ratio rising to 59%, a multi-month high. This indicates that traders have shifted their preference away from calls, and towards buying downside insurance, even as the market trades to 6-month lows.
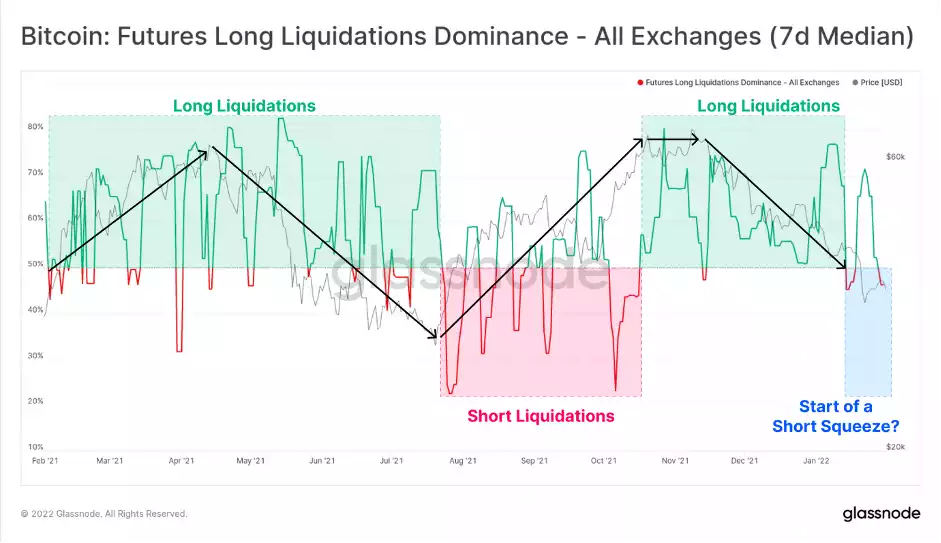
With this observable shift from long into short bias across derivatives markets, the dominance of futures liquidations has started to creep towards the short side. With high negativity, elevated leverage, and an overall short bias, a reasonable argument could be made for a potential counter-trend short squeeze in the near term.
Assessing the demand of the market using on-chain tools is nuanced, and requires an understanding of market participants, and the destinations of spent coin volumes (i.e. in/out of exchanges, in/out of HODLer wallets etc).
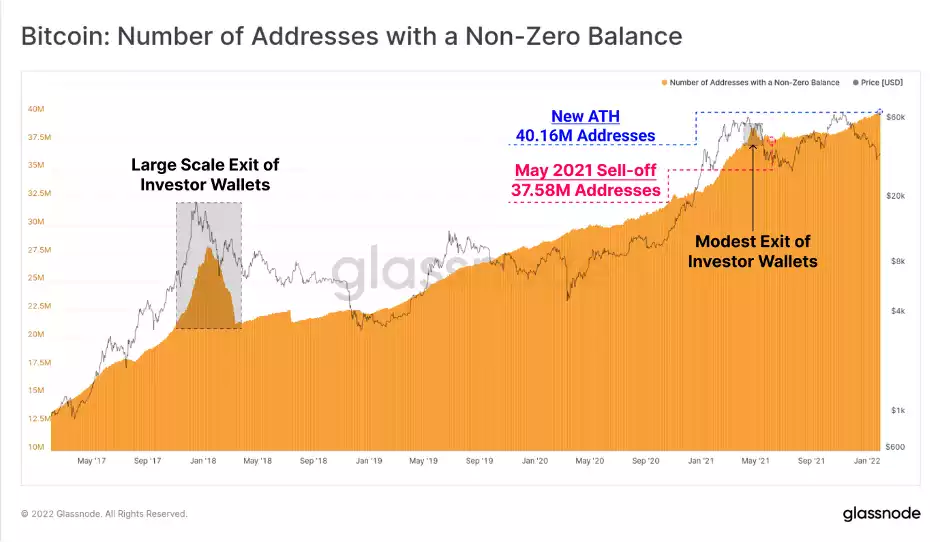
First, we can look at a fairly foundational and simple metric, the number of non-zero wallet balances. Generally speaking, when the Bitcoin network experiences a large scale investor flush out (such as the 2017 blow-off top), investors spend many UTXOs from their wallets, deposit coins to exchanges, and then consolidate that supply into a small set number of large balance wallets.
Such a wallet purge is quite obvious following the 2017 top, and a smaller flush out can be seen in May last year. In both instances, the number of non-zero addresses resumed an uptrend once the dust had settled, usually around the middle phase of the bear market that followed as buyers recommenced accumulation.
The current upwards trajectory of non-zero wallet counts appears to be largely unaffected by the last three months of depressed prices, sporting similarities to the mini-bear of 2019 and hitting a new ATH of 40.16M addresses.
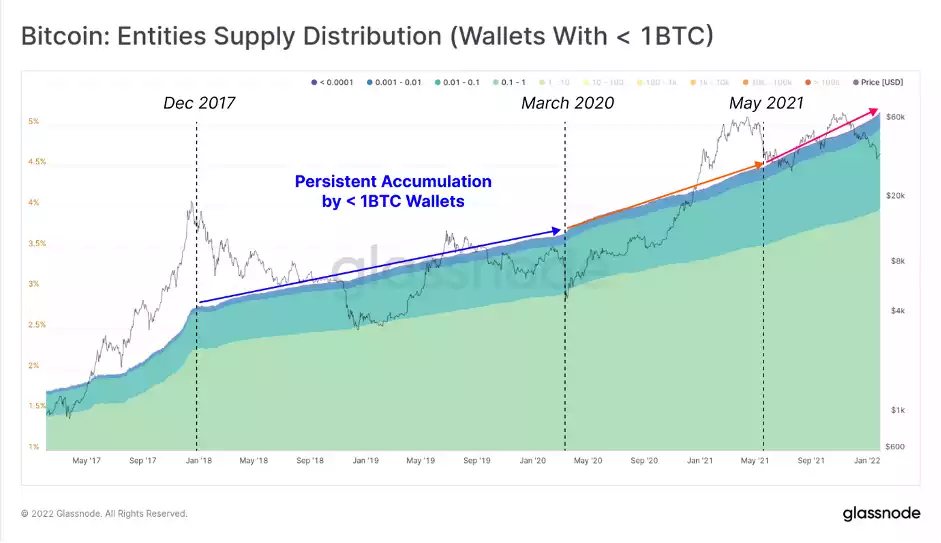
Retail size wallets, holding < 1BTC, also appear unfazed by this correction, with supply held in these wallets continuing to climb. The rate of supply growth for this cohort has seen two macro increases, first after March 2020, and again after May 2021. This speaks to a growing class of 'sat stackers' and HODLers who remain throughout all market conditions.
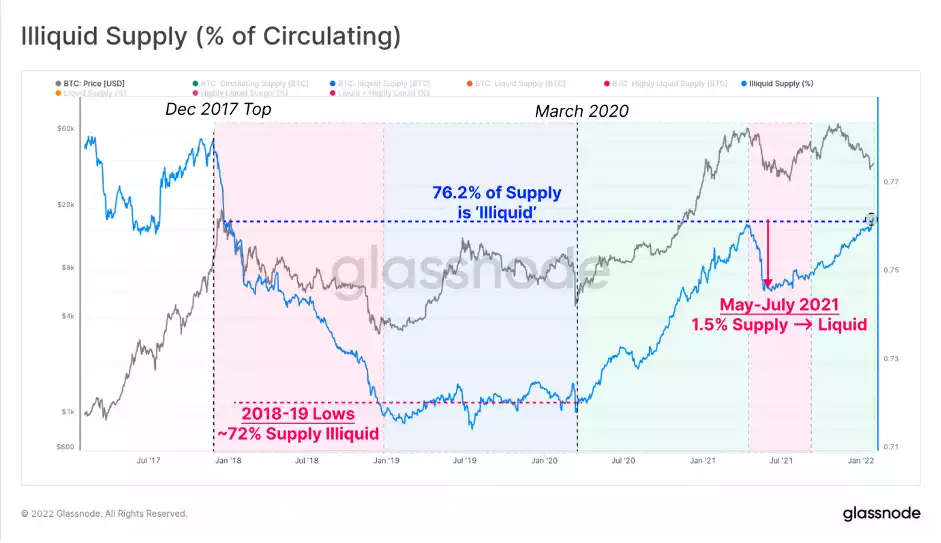
When mapped as a proportion of market cap, the per cent of Illiquid supply (blue) has now reached 76.2% of circulating, returning to Dec 2017 levels. These coins are held in wallets with little-to-no history of spending, and thus reflect a cohort of wallets that are likely in accumulation mode.
- Bearish periods (red zones) such as 2018 and May-July 2021 are punctuated by large declines in Illiquid supply. This means a large volume of coins were spent out of cold storage and must be subsequently absorbed by new buy-side demand.
- Bullish periods (green zones) such as post-March 2020 typically see Illiquid supply increase, as accumulation takes place, and demand soaks up-sold coins.
Interestingly, prices in the current market are declining (bearish), whilst Illiquid supply is in a marked uptick (bullish). This week alone, over 0.27% of the supply (~51k BTC) was moved from a Liquid to an Illiquid state. Within a macro bearish backdrop, this does raise the question as to whether a bullish supply divergence, similar to May-July 2021, is in effect.
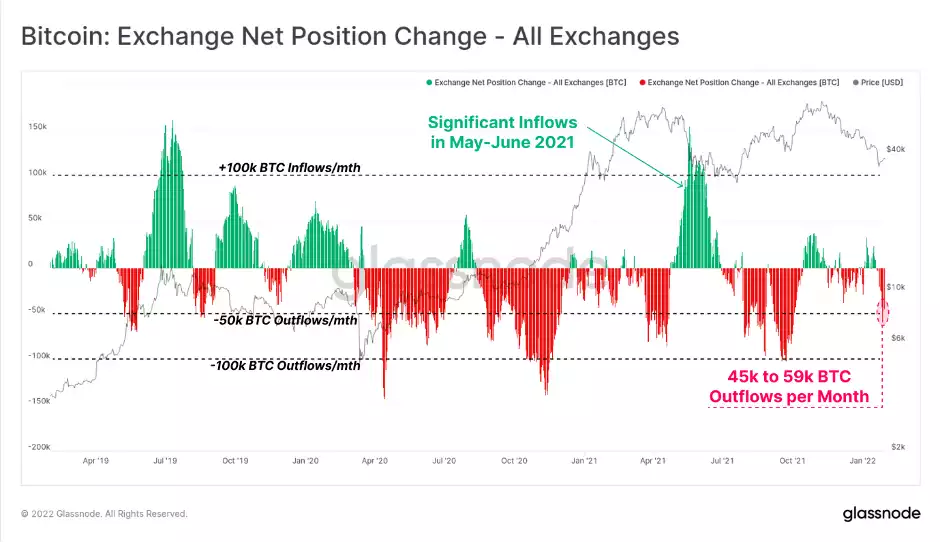
Exchange balances are one of the larger constituents of the Liquid and Highly Liquid supply metrics, and thus it makes sense to look at flows in and out to validate the observations made above. The exchange net position change is a metric showing this net monthly flow of coins in (green), and out (red) of the exchanges we track.
This week, we have seen net outflows of a reasonably high magnitude, with rates between 45k and 59k BTC per month. This has confluence with the increase in Illiquid supply (~51k BTC), indicating that some portion of the exchange withdrawn coins may have moved to colder storage.
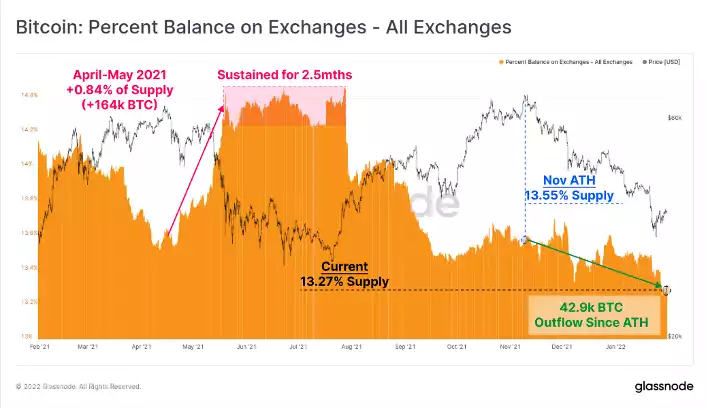
As a result, total exchange reserves have declined to multi-year lows, reaching 13.27% of the circulating supply. It is important to note that this is very different to the market reaction observed in the May-July 2021 drawdown:
- Both periods experienced over 50% price drawdowns from the ATH.
- May-July 2021 saw over 164k BTC (0.84% of circulating) in net inflows to exchanges, alongside a decline in Illiquid supply equal to 1.5% circulating supply.
- The current drawdown has seen exchange balances decline by 42.9k BTC (0.28% of circulating) since the November ATH, whilst Illiquid supply has increased by 0.86% of circulating supply.
Despite equivalent scale drawdowns, the trends in exchange reserves and coin liquidity are trending in opposite directions. The current environment has a markedly more bullish undertone of supply absorption, and far fewer coins are being spent and sold in fear.
The current market appears to have a resilient and persistent class of HODLers, who appears to be in accumulation mode through rain, hail or shine. Onchain settlement volumes are down from the highs, however, are increasing relative to market valuation, suggesting Bitcoin is now closer to a 'fair value' than it is to a cycle top.
Meanwhile, derivatives markets appear to be betting on further downside. Within the context of some believing that we are entering a macro bear, this begs the question; is the market late to hedge out risk, or is it due for an upside correction to shake out this peak in leveraged negativity?