All Eyes on Yellen – Here comes the ‘money’!
News
|
Posted 30/04/2024
|
2360
Markets are choppy, investors are confused. The conflicting signals around the strength of the global economy continue to play on everyone’s mind as they decide where to invest. This week the Fed meet amid 2 months of rising inflation for the first time since last September, the first time for rising PCE, PPI and CPI together. On the same day the US Treasury will announce how it will borrow and spend all the fresh tax deposits sitting in its Treasury General Account (TGA). This Friday we get the April employment numbers. The Japanese Yen is in free fall (more on that tomorrow). It can all look confusing, but it’s really not. It’s all about the debt and math.
The recent falls in share market, gold, bonds, and bitcoin all together have punters on edge. There appears no safe haven. On Friday we released our latest monthly Macro and Global Liquidity Analysis: Gold, Silver, and Bitcoin - April 2024 where we discussed the fall in global liquidity last month. Such is the market’s correlation with our metrics on this, it came as no surprise to regular readers/viewers. They also know its short lived.
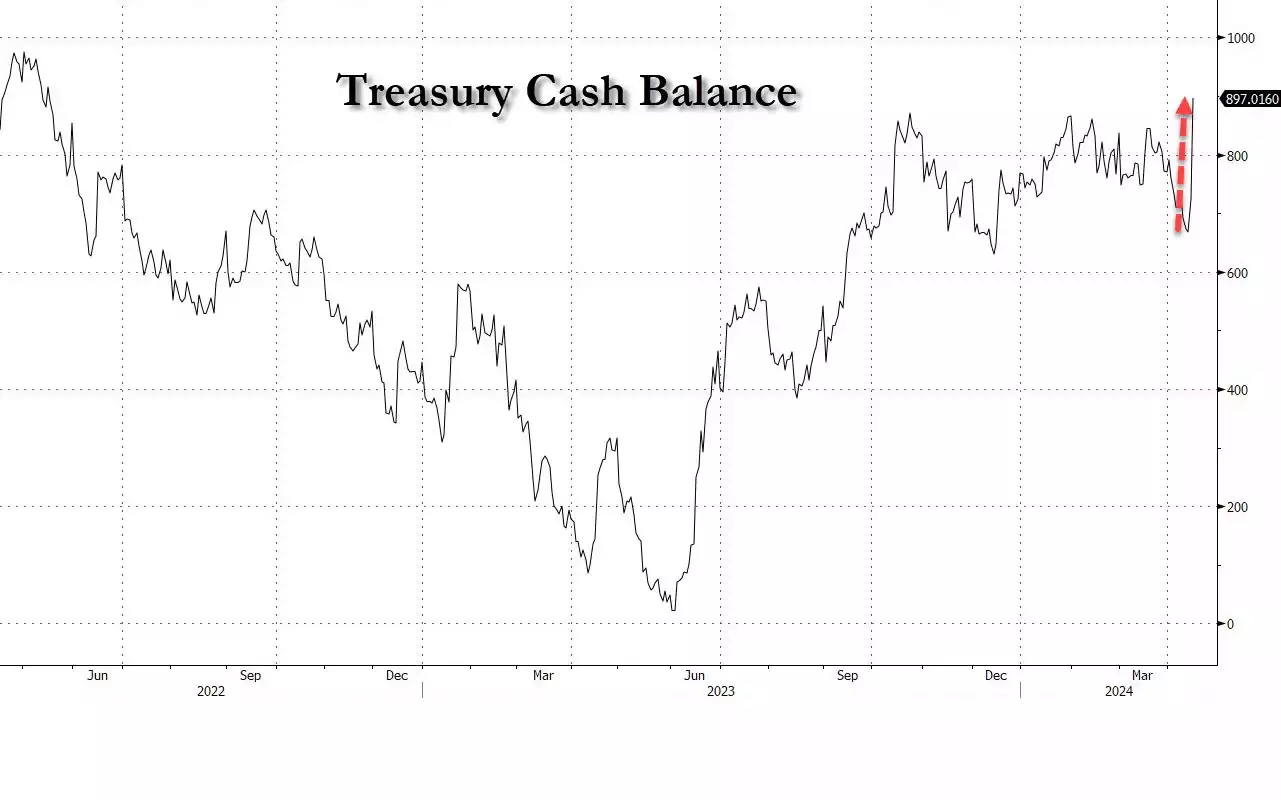
The reality is that regardless of the Fed’s decision to (inevitably) leave rates as is amid persistent inflation it is not monetary policy that is dictating terms, it is U.S. fiscal policy that appears the main driver. There is now a heap of money sitting in the TGA, nearly US$900 billion, money that has been effectively drawn out of the U.S. economy and hence that ‘air pocket’ of liquidity.

When Yellen speaks on 1 May, all ears will be on how she plans to spend this and of course borrow even more through issuing more bonds. She has, simplistically, 3 clear options right now:
- Pause issuing treasuries and spend all of what’s in the TGA > a nearly $1tn injection of liquidity.
- Issue more short-term Treasuries (T-bills) draining the Reverse Repo Market > a $400bn injection of liquidity.
- Combine both of the above options, again issuing no long term bonds at these high rates (extending the record breaking inverted yield curve) > a $1.4tn injection of liquidity.
There are few certainties in life, but one is that incumbent government’s, particularly unpopular ones (and the latest Gallup poll has Biden as the most unpopular President at this point in a term in over 70 years), spend like drunken sailors to win votes. When you have nearly US$1 trillion sitting in your ‘savings account’ and a credit card seemingly without a limit or consequences… well… you know…
So let’s look at a couple of charts to remind ourselves of said consequences…

But the above is just the U.S. Government. The chart is critical to anyone who understands nothing more than math. There is nearly US$100 trillion of total debt in the .US. The U.S.’s total GDP sits around US$27 trillion. Debt is growing far quicker than GDP. The chart below is from the Fed themselves and in a ‘picture’ tells the scary thousand words around why this has only one outcome.

Put simply, the red line generates the income to pay the interest on the blue line. The blue line is consistently pulling away. You will note we crossed the Rubicon soon after we left the gold standard and the fiscal discipline it enforces. There is no longer any semblance of fiscal discipline other than the ‘discipline’ of ensuring you print enough new money, by issuing more debt, to pay the interest on the debt you already amassed.
It’s math.
The injection of this new liquidity drives everything. If you haven’t already, you need to watch this carefully.