All Eyes on US Land Markets for Macro Cycle Peak Signals
News
|
Posted 10/09/2025
|
2583
With the 18.6-year land-debt cycle nearing its peak, US land markets are under close watch for signs of a macro turning point. Historically, a peak in this cycle signals challenging times ahead for stocks, risk markets, and property—while still offering upside potential for precious metals.
Leading into this peak, informed investors typically begin rotating out of equities, land, and other risk assets into gold and silver. This strategy is designed to weather the downturn and the subsequent recovery, which often involves stress or failures across banks, pension funds, and hedge funds.
Notably, land markets tend to peak before stock markets in this cycle. This divergence serves as a key leading indicator, as seen ahead of the Global Financial Crisis nearly 18 years ago.

As shown, the homebuilders ETF entered a sustained macro downtrend on the weekly chart, even as the S&P 500 continued its climb toward the peak. With the recent strength in land markets, attention now turns to whether we see a macro lower high and rollover—suggesting the divergence has begun—or a break to new highs, indicating further runway for this cycle.

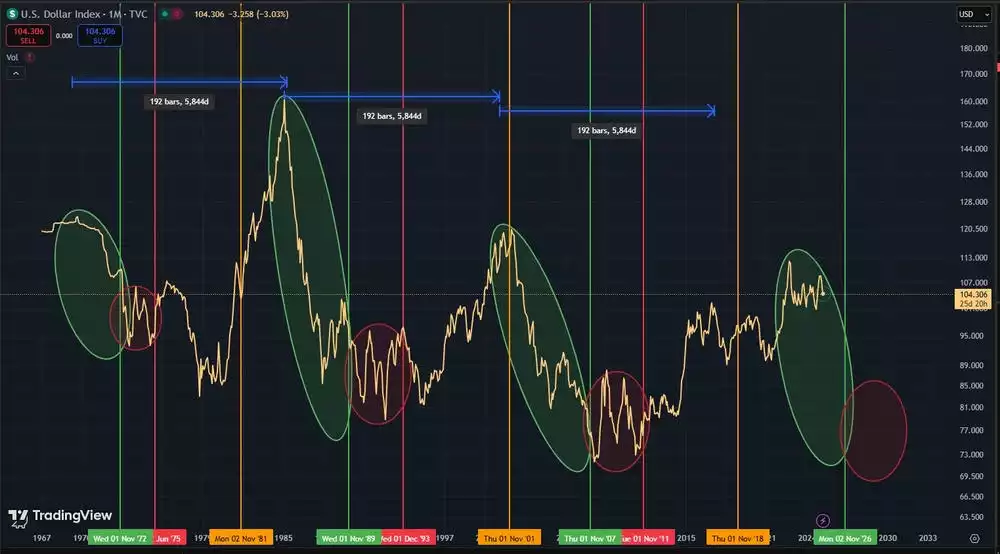
Long-term data—spanning some 350 years—suggests the peak should occur between 2024 and 2028, with the average timing pointing to early 2026. As we approach this window, increasing volatility and sentiment swings are typical, culminating in broad complacency across markets.
Leading into previous land cycle peaks, the US Dollar Index (DXY) has tended to follow a macro downtrend (green phases). This downward pressure typically acts as a tailwind for most assets, fuelling optimism and risk-taking as the cycle matures.

With the US Federal Reserve all but confirming rate cuts this month, the DXY’s downtrend looks set to continue. The bond market appears aligned with this outlook—yields have fallen in recent weeks in response to the Fed’s guidance—suggesting inflation is no longer the primary concern amid an easing policy stance.
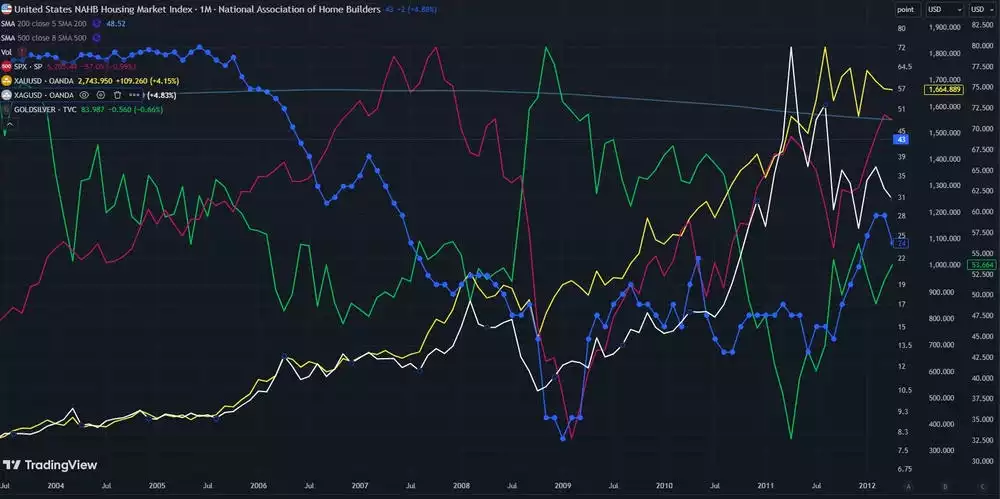
As we scan the horizon for signs of a macro peak, it’s worth revisiting the dynamics between land, stocks, gold, silver, and the Gold-to-Silver Ratio around the Global Financial Crisis and the recovery that followed.
Back then, land (blue) began its decline before stocks (pink), though both found a bottom around the same time. Gold and silver maintained uptrends into the equity market peak, briefly dipping during the crash before resuming strong rallies—silver even entered a parabolic phase—while equities and property took years to recover. During this period, the Gold-to-Silver Ratio (green) dropped to 35.

Whether this upcoming peak occurs on schedule or runs longer than average, the land market will likely provide the clearest signals. For now, the focus remains on identifying either a macro lower high or a breakout to new highs.