A Decade Of Silver Price Appreciation: How Soon Could It Hit US$500/oz?
News
|
Posted 12/11/2026
|
426
Key Takeaways
- Silver has historically run in 20-year bull phases built from 8-year cycles.
- If history repeats, the current run could last into the early to mid 2030s.
- Reaching US$500 would likely need gold above fair value and a lower gold to silver ratio.
- Rising bond yields have historically marked an inflationary regime that suited silver.
Silver’s 8 year cycle & Technical Cup and Handle
Silver, like most commodities, goes through macro cycles of price increase and consolidation: more specifically, it has historically put in a major low every 8 years. A left translated bullish cycle will see a peak to the left of the midpoint (4 years from the low) and a right translated cycle will see a peak to the right of the midpoint.
The image below shows silver’s tendency to put in a right translated, muted bullish cycle, followed by a right translated aggressively bullish cycle, culminating in a left translated aggressively bullish cycle, before it enters an extended period of consolidation. This was recorded in the run from 1960-1980 and again from 1990-2010, each run up lasting a total of approximately 20 years.
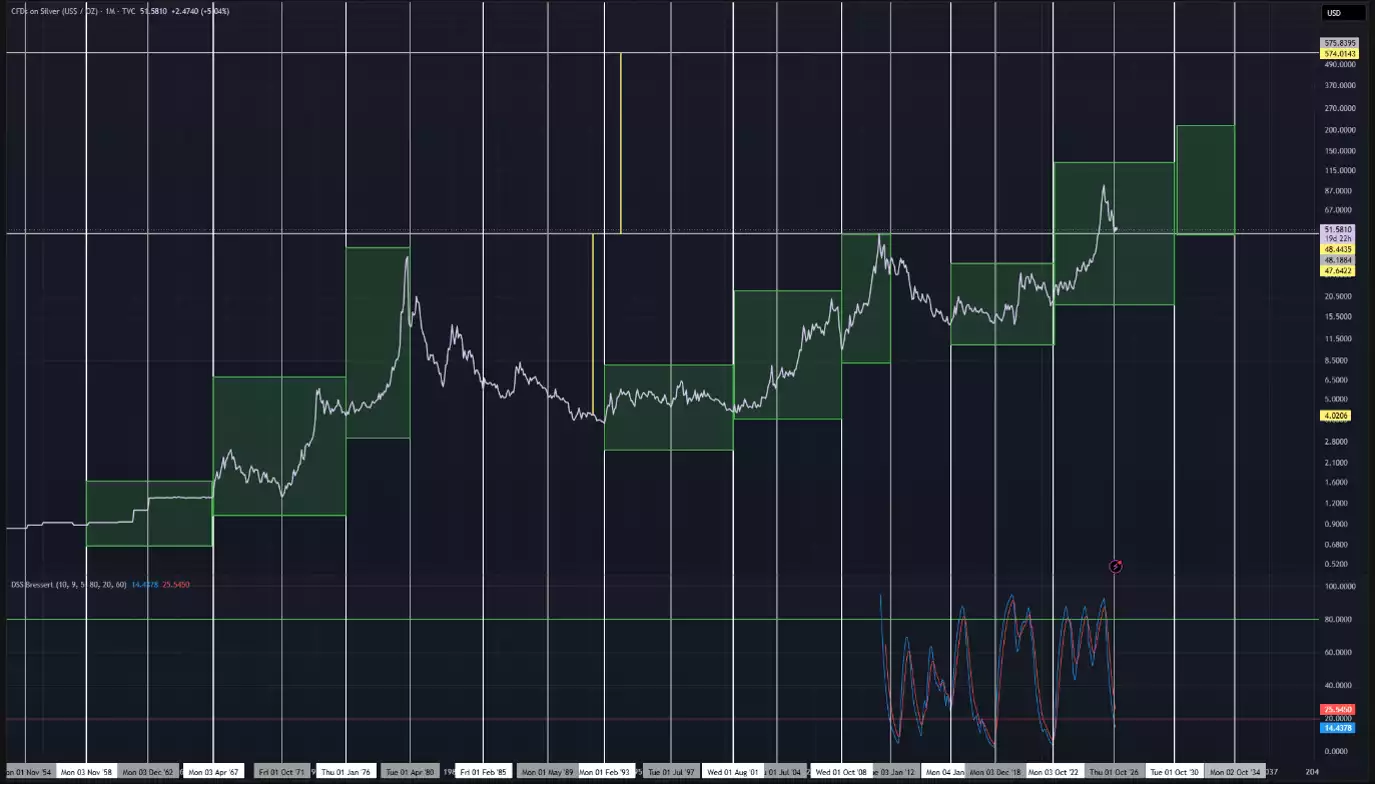
The current run up started in 2015, and if history were to repeat, could last into the early to mid 2030s.
To add further confluence to this timeframe for bullish price action, we have seen the right translated muted bullish cycle (2016-2022), and are currently exactly half way through what could shape up to be the right translated aggressively bullish cycle (2022-2030), which could be followed by a left translated aggressively bullish cycle (2030-2038, peaking before 2034).
While silver has recently broken out of a 45 year long, historic cup and handle pattern with a projected target of approximately US$500 (shown in the chart above), it is uncertain whether this target will be met by 2034, as cycles predict time and not price. Silver broke through the US$50 ceiling of its 1980 and 2011 peaks in October 2025 (Investing.com, 24 October 2025 (https://uk.investing.com/analysis/silvers-50-breakout-why-this-pullback-is-a-healthy-retest-not-a-reversal-200619650)).
US Government Debt and the Debt to Gold Ratio
Michael Howell / CrossBorder Capital (Capital Wars research) has a gold projected value at roughly US$15,000/oz in the mid 2030s, based on the projected US government debt and the debt to gold ratio (Metals and Miners interview, 20 February 2026 (https://metalsandminers.substack.com/p/michael-howell-supreme-court-war)). The model holds the “gold value” of Federal debt roughly constant (or within historical debt/gold-ratio channels, measured relative to the world gold stock) (Capital Wars, 28 September 2025 (https://capitalwars.substack.com/p/gold-at-us10000oz-and-the-fiscal)). Because the gold stock cannot expand in the same way as debt or liquidity, the gold price must rise in proportion to keep the real (gold-denominated) value of the debt from drifting higher indefinitely.
While Howell’s projected value sits around US$15,000/oz, markets regularly move well above and below fair value. Commodities, in their final legs of macro bull cycles, regularly have euphoric blow off top phases, with Elliott wave 5 often being the strongest in commodities, the “fear” wave (LuxAlgo, citing Frost and Prechter’s Elliott Wave Principle (https://www.luxalgo.com/library/concept/wave-extension/)).
At a projected value of US$15,000/oz for gold, and a gold to silver ratio of 50 (a level the ratio has traded below for long stretches of the past century), that gives us a silver price of approximately US$300.
What would be required to get the cup and handle target of US$500/oz hit during this timeframe is a combination of the gold to silver ratio dropping below 50 (historically common during the final leg of a macro silver bull run) as well as gold moving up above its own projected fair value.
The Gold To Silver Ratio Over “The Four Turnings”
The chart below shows us the gold to silver ratio over 100 years (light blue). While the run from 1960-1980 saw this ratio consistently below 50, the run from 1990-2010 only saw brief spikes below 50.
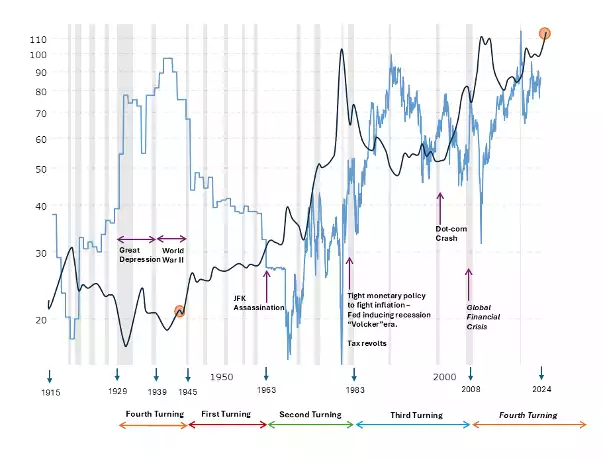
The chart above outlines “The Four Turnings”, the framework set out by William Strauss and Neil Howe in their 1997 book The Fourth Turning: four, roughly 20 year phases in a macro 80 year socioeconomic cycle, each with characteristic generational archetypes and macroeconomic landscapes, going back over the last 600 years approximately (Wikipedia, Strauss-Howe generational theory (https://en.wikipedia.org/wiki/Strauss%E2%80%93Howe_generational_theory)).
Notably the first and second turning of the current 80 year cycle, saw the gold to silver ratio sub 50 (around 40 through the 1950s, falling to 18.5 in February 1970, per EDR Silver (https://edrsilver.com/site/assets/files/15040/is_the_gold-silver_ratio_relevant_today.pdf)).
With the first turning of the next 80 year cycle around the corner, history suggests a fall off in this ratio could follow.
US Bond Market
Finally, looking at the US bond market, we can see bond yields spend decades rising (first and second turnings 1960-1980 precedent for silver’s 20 year run up) with the relative strength index (RSI) above 50 on the 3 month chart, after breaking out of a multi decades downward sloping trendline. This phase of rising yields has historically been an inflationary regime. With silver overlaid, we see it performed very well (with the gold to silver ratio under 50) in this phase.
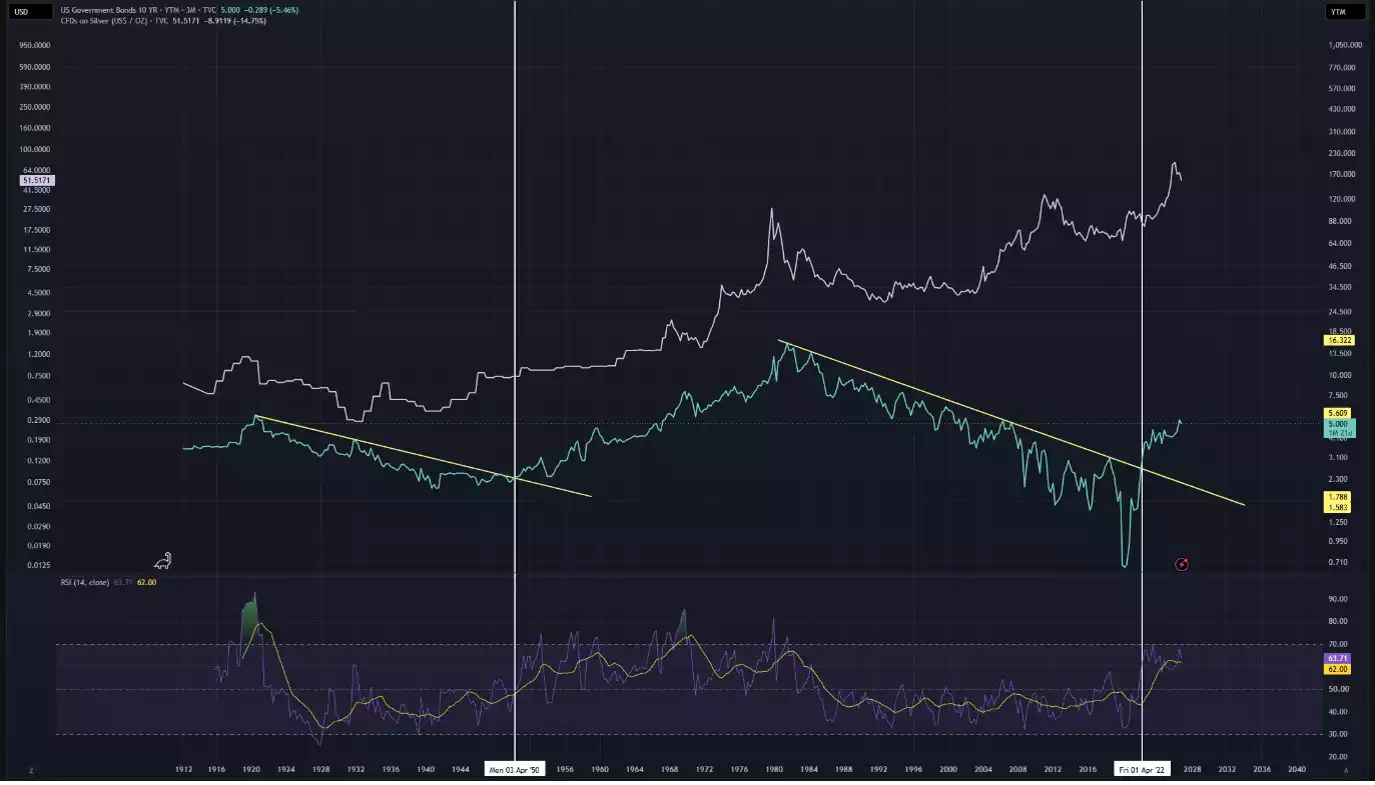
We can see in 2022 the US 10 year bond yields broke out of this trendline with the RSI moving and holding above 50, signalling what could be our transition into an inflationary regime once again.
The bond market adds further confluence to the case for silver performing well over the upcoming decade, with the potential for the gold to silver ratio below 50.
What Could Challenge The Setup?
Silver traded at US$52.31/oz on 11 November 2026, back near the old US$50 ceiling after a nominal all-time high of US$121.64 in January 2026 (Trading Economics (https://tradingeconomics.com/commodity/silver)). If that January high holds as the 2022-2030 cycle peak, the cycle would be left translated, not right translated. At the ratio’s median of 62.9 since 1971 (EDR Silver (https://edrsilver.com/site/assets/files/15040/is_the_gold-silver_ratio_relevant_today.pdf)), US$15,000 gold would imply silver nearer US$240 than US$300.
Silver’s 8 year cycle profile, its technical cup and handle pattern, the US government debt projections, the four turning precedent and the current state of the US bond market are some of the factors pointing towards a bullish setup for silver. While there are no guarantees in markets, many precious metals investors aren’t concerned solely with price appreciation, but rather financial sovereignty and the insurance policy of holding their wealth in a God given asset, while the human made systems are tested in the transition from one world order to the next.
Ainslie Bullion offers a full range of silver bullion (https://ainsliebullion.com.au/Buy) for investors following the cycle.
This article is general information only and does not constitute financial advice. Past performance is not indicative of future results. Always conduct your own research or consult a licensed financial adviser before making investment decisions.