2020 World Silver Survey – The Silver Institute
News
|
Posted 24/04/2020
|
29591
The annual World Silver Survey by The Silver Institute looks at 2019 supply and demand. We summarise the key takeaways from this 86 page report.
2019 Supply – barely unchanged from 2018
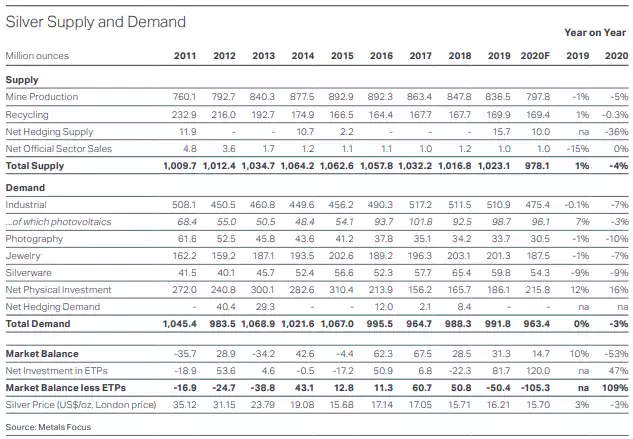
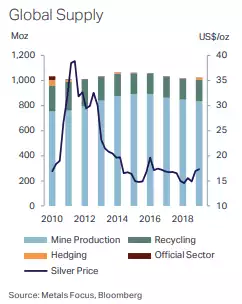
- Mine Supply fell 1.3% from 847.8m oz to 836.5m oz (26,019t) and 2020 forecast is a further drop to 797.8m oz
- This was the fourth consecutive annual drop in mine supply.
- This was a result of declining grades at several large primary silver mines, lower silver production from copper mines and notable disruption losses at some major silver producers.
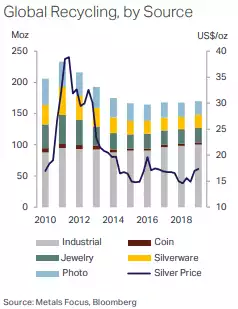
- Recycling increased 1.3% from 167.7m oz to 169.9m oz (5,284t) and forecast to be steady in 2020
2019 Demand – barely unchanged from 2018 overall but large changes in composition
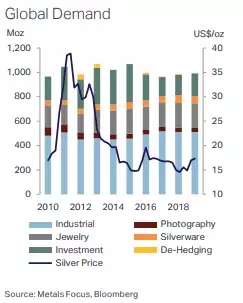
- Global silver demand increased 0.4% from 988.3m oz to 991.8Moz (30,848t) and 2020 is forecast to drop to 963.4m oz.
- Healthy gains in physical investment and demand from the photovoltaic industry, as well as smaller increases in ‘other industrial’ category. However, these were largely offset by losses elsewhere in electrical and electronics applications, silverware and jewellery. Breaking that down:
- Industrial was down 0.1% to 510.9m oz (15,891t) and only 1% from the all time record in 2017 despite a 7% jump in photovoltaic (98.7m oz )
- Photography still a surprisingly significant 33.7m oz (1,047t) continued its decline (-1%)
- Jewellery was down just 1% to 201.3m oz (6,262t) despite the biggest market, India, falling 5% off the record high in 2018.
- Silverware dropped a substantial 9% to 59.8Moz (1,860t) again due mainly to economic conditions in India and projected to drop further in 2020 due to broader economic conditions, along with jewellery.
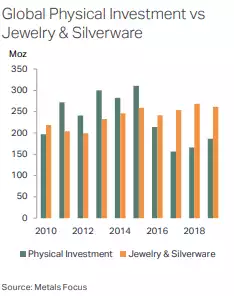
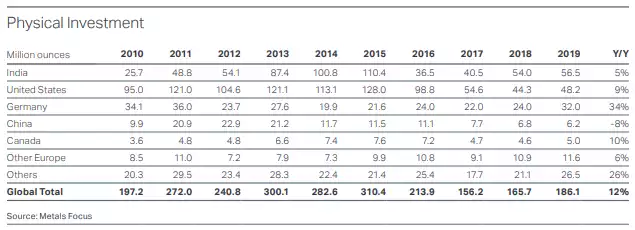
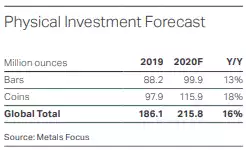
- Not surprisingly physical investment demand jumped a substantial 12% to 186.1m oz (5,788t), it’s largest since 2015. Geographically the biggest gains were in Europe (+25%), the US (+9%) and India (+5%). In 2020 they see this jumping again to 215.8m oz (up 16%). Curiously The Silver Institute put ETF’s ‘below the line’ (see the next point and overall table below).
- Institutional investment fared even better than physical demand in 2019. Exchange-traded product (ETP) holdings for instance rose a whopping 104m oz (3,235t) to a record 81.7m oz, while money-managers’ net positions in Comex futures went from being short over much of 2018 to consistently positive in the second half of last year. This sea-change in investor attitudes towards silver was mainly due to improving sentiment towards gold. Moreover they are forecasting a further jump to 120m oz in 2020.
Below is an interesting table showing who the main investors in physical are:
And a breakdown of bars versus coins last year and their forecast for this year (how they can predict demand is anyone’s guess, and let’s face it, their guess too):
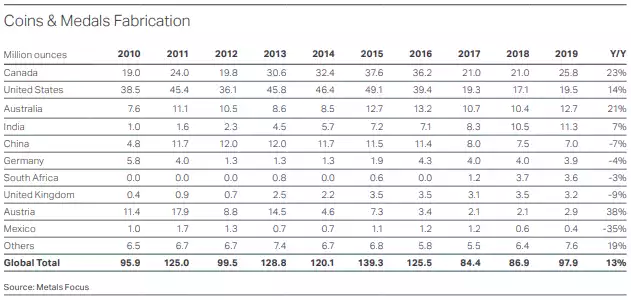
And finally, a look at who makes the most coins. Not surprisingly Australia’s Perth Mint numbers jumped with the introduction of the more economically packaged Kangaroos in 2015 and putting Australia at number 3 after the Royal Canadian Mint Maples and US Mint Silver Eagles. Interestingly both RCM and US Mint are closed and not taking orders and Perth Mint likewise haven’t been taking orders for some weeks now as they work through a massive backlog.
The overall summary is below showing a net shortfall of 50m oz between supply and demand and forecast shortfall of 105m oz this year.
