1 Year Since the Crash – Silver Lining
News
|
Posted 24/03/2021
|
10137
Incredibly it is already 1 year ago that sharemarkets bottomed in the COVID crash. Amid all the unprecedented statistics of GDP plummeting and job losses, few would have predicted one of the fastest and strongest recoveries in share prices since – but that’s what has happened.
The chart below lists all the main US sharemarket indices which range from 76% for the S&P500 up to 122% for the small cap growth shares of the Russell 2000 and the NASDAQ in between at 94%.
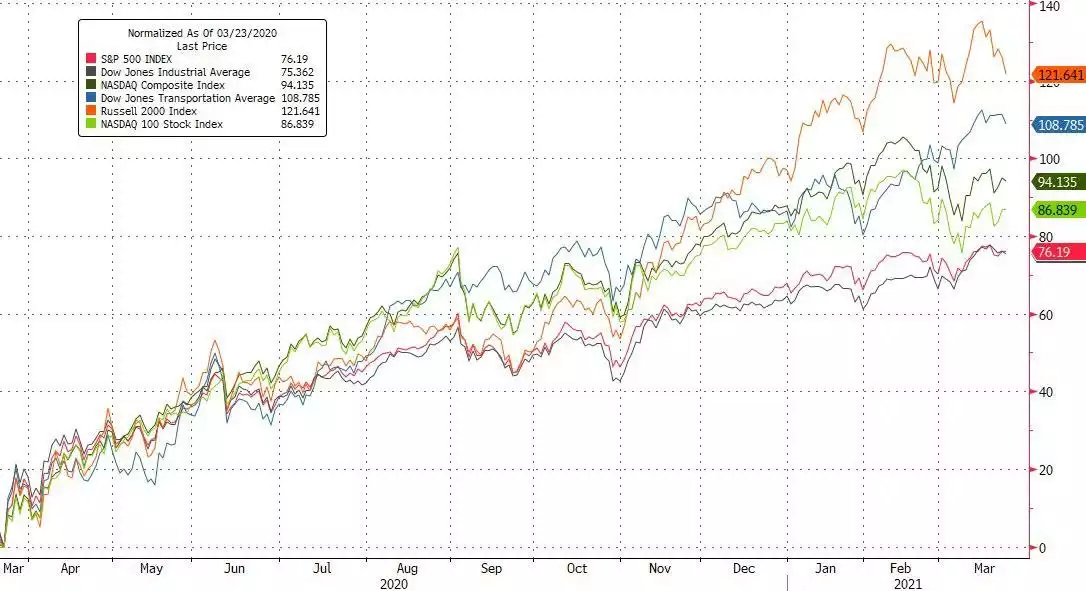
That 76% for the S&P500 was the strongest 12 months since 1936. The question is of course… where to from here? Whilst on the topic of 1936, below is what happened the year after…. It essentially lost ALL of its gains the year after in an epic crash.
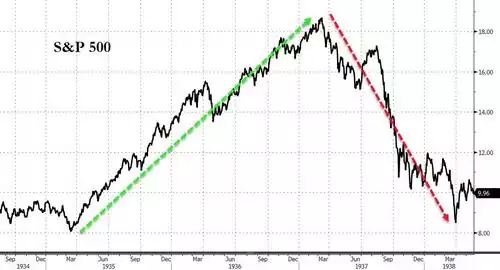
History of course doesn’t necessarily repeat so let’s remind ourselves of what brought us to these new record highs…
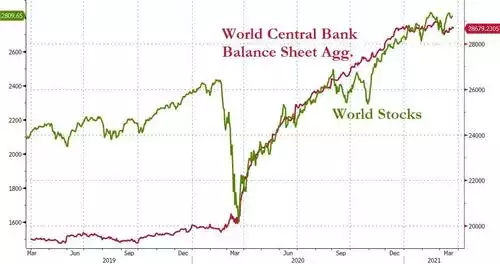
You might notice a ‘slight’ correlation between the rebound in global shares and the pumping of an unfathomable $17 trillion of newly created cash and corresponding debt into the system.
Australia’s ASX200, arguably because our central bank was late to the stimulus party, has seen ‘just’ a 40% rise over this same period.
On Monday we shared the “No Way Out” article outlining the dilemma these global central banks currently have. Keep printing and risk runaway inflation and an even bigger bubble, or stop printing and have a repeat or worse of 1937 at a time when fundamentals are still relatively weak.
Looking closer at the hero performer of the Russell 2000 and we remind you the chart from that article showing the rather ‘hopeful’ basis of current valuations this year of over 60x price earnings…
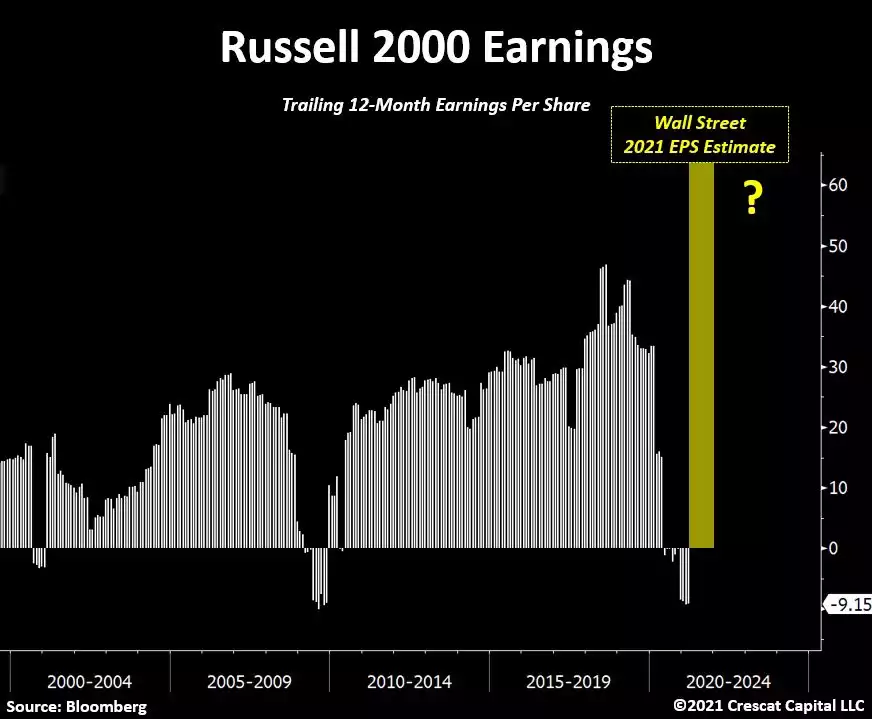
Tweeting to this new record for growth stocks, Crescat’s Otavio Costa charts and asks the obvious question that should be on all investor’s lips:
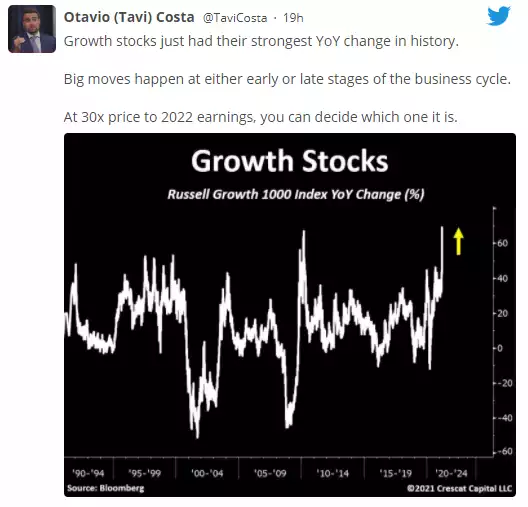
The market may already be voting with its feet with this same index having its second bad session last night, now down a chunky 4.25%!
So how about gold and silver over this same period? You may recall that gold sniffed out the coming issues early with the Chinese outbreak and rallied hard from the beginning of the year, up 19% before the broader market crash and liquidity squeeze saw it drop 4%. It then rallied through to its $2860 (AUD) high in August. From there, the ‘its fixed!’ narrative and raging sharemarket saw it fall almost constantly to the current $2265 level. And so over that same 12 month period that saw shares hit new highs, gold actually fell 7%.
Coming back to Tavi’s question of whether this is early or late equities cycle may also be instructive on your view about the historically uncorrelated gold price. One would expect a relatively weaker gold price whilst shares have rallied like this. The question then for investors apart from simple diversification, is what does the future have in store as the past is already the past. Tavi is clear in what he thinks. 1937 could happen again.
By comparison to gold, silver fell harder in March 2020 but has since rallied 89% to that same August high, and remains up 55% for the 12 months. Silver is in a special place compared to gold right now which supports further growth despite that outperformance. Silver is the potential benefactor in the reflation that comes with all that stimulus, the benefactor in the green push, and the benefactor in a widely reported squeeze in silver supply. The price action in the last 12 months of silver needs to be viewed in the context of years of under performance compared to gold. This could be the start of a truly epic run for silver out of gold’s shadow.